Relief Before Recession Risk
working off oversold conditions, internals are shifting, but don't lose sight of EPS headwind
At the start of the year in From Tailwinds to Headwinds outlined the challenge of peak liquidity, peak valuations and peak earnings coming into 2022. Subjectively, we have made progress correcting peak liquidity and valuations, but peak earnings remain an overhang that significantly constrain upside.
The best way to describe the trading environment is one step forward two steps back. Fortunately, we are currently moving one step forward after a nasty, swift fall from late May.
As previously noted, trading against one’s core view is not easy and not for everyone, but if you can avoid sharp bear market rallies it eases anxiety and allows for better entry points on shorts.
1 step forward, 2 steps back
A potential turning point was identified at the start of this week. Oversold conditions, depressed sentiment, and some signs of behavior change during the June correction all led Mr. Blonde to believe we could bounce.
So far the move has is directionally uninspiring, but tone has shifted somewhat and some big internal rotations as we shift “from fed hikes to growth cuts” narrative. Weak growth isn’t good, but happens more slowly and is more easily digested by equity investors than a series of 75bps rate hikes.
Best guess right now is the bounce can last into early July. More on seasonals below, but they tend to be strong through July 4th week. Then expect anxiety over 2Q earnings season to increase. SPX can rally to 3950 before hitting its 20d avg and stays in firm downtrend.


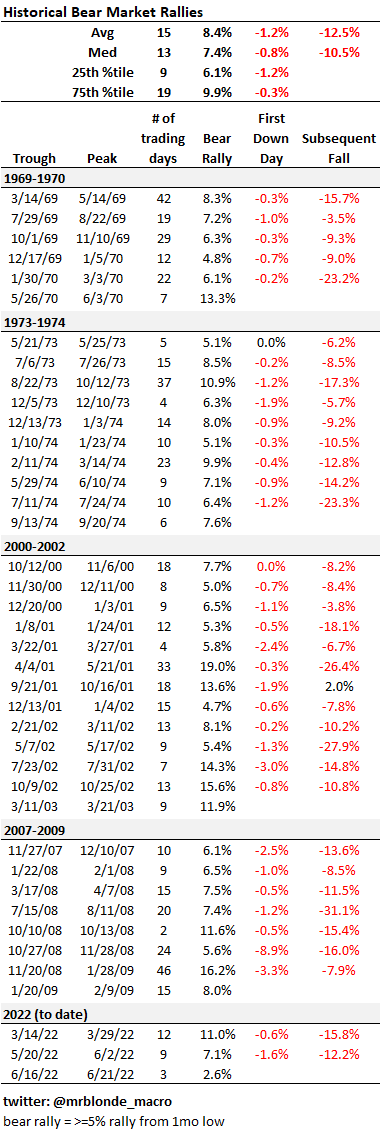
How far we go is anyone’s guess, but the average bear rally is 7-9% and occurs over ~15 trading days. They are often violent affairs and the moves in the more stressed parts of the market are way above average (i.e. short squeezed).


Closer to Capitulation?
Another reason Mr. Blonde got interested in the possibility of a bear rally was finally reaching historically important threshold of -3 after the correction in energy, utilities and staples groups as well as the further fall across the market.
Could it go more? Sure. Will it? probably, but can’t be too dogmatic and need to swing at pitches to get on base. The models are there for a reason and designed to guide, reduce emotion and improve judgement.
Historically, buying equities after the first -3 reading has proven a good 6mo entry point with a few exceptions—only Madoff has a model with 100% hit rate. The longer your holding period the more relevant the signal.
In Mr. Blonde’s judgement we will dip below the -3 threshold again and likely reach lower readings, but appreciating the progress made to date is important and can’t be too dogmatic.
Narrative Shift?
Also catching Mr. Blonde’s eye recently is the shift in market internals and correction drivers. Consistent with the opinion that the narrative will shift “from Fed hikes to growth cuts” as the year progresses the parts of the market that led the correction were more GDP sensitive and less Fed/rate hike sensitive.
An imperfect, but relevant, measure and certainly topical is the relative performance of secular growth vs. cyclical growth stocks. Secular growth stocks will carry higher absolute valuations given growth, profitability, and volatility of growth characteristics where cyclical growth stocks often have high beta to GDP and tend to trade with lower absolute valuations.
MSZZGRCY Index actually turned up during the June correction and after leading SPX lower from Sept of last year. This is a change and one that fundamentally makes sense as market shifts towards earnings risk from valuation risk. Also notable how oversold this ratio is relative to recent trend and the full retracement of outperformance from 2016.
This change in behavior doesn’t tells us much about the direction of the market, but a change in character and potential change in leadership is important to monitor and can be an important signal about what the market thinks comes next.
Recession Risk Pricing
Mr. Blonde has already communicated his view that growth is slowing (here, here, here). Increasingly the debate has shifted to how much slowing and when is the market priced for “recession.” A few historical observations on this and then will provide a best guess at what SPX level fully discounts a recession with the caveat that history doesn’t repeat but often rhymes.
EPS declines around recessions are reasonably consistent at -17% from peak. 2008 was more the exception than the rule given the nature of crisis (i.e. financial sector write-offs).
EPS trough often comes at the tail end of the recession or more likely after it is over
S&P 500 price trough is generally 9-12mos before the EPS trough
LTM P/E at the price trough is ~12x, but 14.5x post 1990
The price trough on trough EPS (only known in hindsight) was ~13.5x and ~16.5x post 1990
The 1953 recession occurred after an earnings recession, so its excluded from the valuation trough stats
Great, so what does that all mean. Current S&P 500 LTM EPS is $216. Rolling out of lower 2021 EPS and moving forward a couple quarters should result in an LTM EPS of ~$223.5, which we will assume is peak LTM EPS. If EPS falls 15%— a bit better than the median drawdown —then we end up with $190.
12x $223.5 = 2682
14.5x $223.5 = 3241
Averaging the two results in a S&P 500 price trough of ~2950
13.5x estimated trough EPS of $190 = 2560
16.5x estimated trough EPS of $190 = 3130
Averaging the two results in a S&P 500 price trough of ~2850
EPS Check
First, is $190 a reasonable trough EPS estimate? Well Mr. Blondes earnings growth leading indicator which he’s been sharing for months to war of impending profit slowdown and likely profit recession suggests S&P 500 is at risk of falling 13% in 2023 vs. year ago levels. That’s pretty close to the typical 17% EPS decline during past recession periods.
The message from ISM falling to 50 or a bit below as consistent with recession conditions would suggest NTM EPS will miss expectations by 15-20%. Current NTM EPS is $238 and a 20% miss would equate to $190. Go figure.
Finally on earnings, they are currently running well above trend. During US recessions of varying type its common for earnings to revert to trend if not fall a bit below. Considering the growth rate in trend it would indicate LTM EPS mean reverting toward $170-175.
Is the Price Right?
So, is ~2900 a reasonable target to price in a EPS recession? That would represent a 39% decline from peak price and put this period on par with 1970 (first inflation wave), 1974 (inflation driven recession), 1987 (liquidity shock), and 2001 (TMT bubble w/ mild recession). Each of these periods has been referenced in the last year as a possible analog, so its not just random but they also averaged a -39% peak/trough decline. Go figure.
Are you gonna bark all day little doggie or are you gonna bite?
A few portfolio ideas Mr. Blonde is focused on.
Embrace the Bear Rally…for Now
For starters, Mr. Blonde reduced shorts and has layered in some long risk with the view oversold markets can frustrate bears for the time being. In addition to the points made above, the seasonal window into the July 4th holiday week tends to be one of the better times of year. Admittedly its always difficult to put much weight on seasonality and even more difficult in fundamentally challenged years.
If you don’t like the directional play, then long NDX/short RTY is interesting and consistent with narrative shift “from fed hikes to growth cuts” given the growth cyclicality difference between indices. NDX has been the focal point of the last 6mo’s correction and if narrative shifting as mentioned above we could see focus shift toward leveraged balance sheets and recession concerns. Generally speaking, pair trades are better for the current environment.
Shifting Narrative
In From Bad to Worse, Mr. Blonde studied historical periods of falling ISM and rising core CPI as a proxy for stagflation environments, or at least environments that had that feeling. We are now shifting to an environment of falling manufacturing ISM and falling y/y core CPI. Such environments are less negative, but still weak for cyclicals/defensives and still favor defensive allocations.
A equity trades Mr. Blonde likes that fit with the history summarized above:
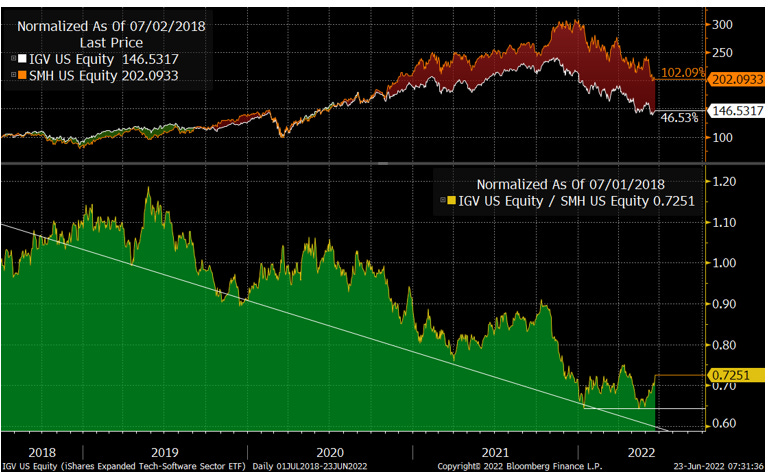
Software > Semis. A clean, sector neutral way to play a shift back toward secular from cyclical growth is long software and short semis. This view has been shared already here, here, and here. Mr. Blonde likes that the pair held early 2022 support and now as macro narrative shifts towards peak inflation and growth concerns it favors such a rotation.
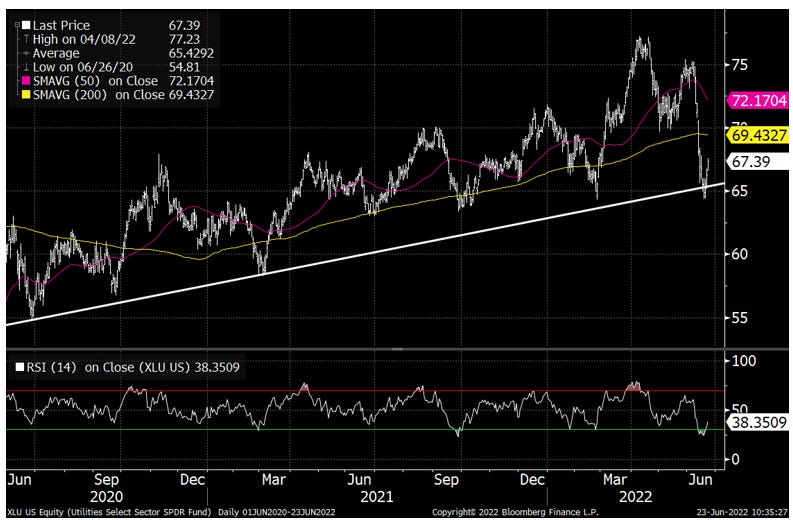
Utilities. Nothing particularly exciting here, but utilities sector sold off hard in June into multi-year uptrend support and now coming off oversold levels. The table above flags utilities as one of the best performing sectors during periods when both ISM and core CPI are falling. Seems like a good, defensive way to add long exposure for a trade.
Not discussed above, but still like keeping a small long duration position in the books with the opinion the worst of inflation momentum is behind us and the Fed will get what it wants at the expense of weaker growth outcome. Maybe yields won’t fall alot and we are in a new regime as so many now believe, but its unlikely they are going to rise much as growth slows and recession probabilities rise.
That’s all for now. If you appreciate the work please like, share, comment.


Thank you for another excellent piece!
Mr B, your commentary over the last 12 months has been absolutely brilliant. Bravo sir 👍
Tell me I’m stark raving mad but I’ve put some money to work in beaten down high beta exposure as a play on falling yields.
Falling yields don’t trump fundamentals but as a short term trade with some added spice I like it. I’m keeping a keen eye on energy and will look to close out this trade if this resumes it’s march higher.
I don’t know if you ever plan to go behind a paywall or if there’s a way to donate and support such fantastic content. I’d be the first to sign up.
Best wishes.