Stuck in the Middle
Relief rally, but now what?
First, big thanks to @MacroAlf, @Callum_Thomas, @HarksterHQ, and @Rory_Johnston for recommending my work and welcome to the thousands of new followers. Please take a minute to read the about page to understand Mr. Blonde’s approach and what these posts are all about.
You won’t find doom and gloom, nor will you find rainbows and unicorns. The focus here is data-driven framework to engage and profit from markets for what they are, rather than what we think they should be. If you appreciate the work, please like it, share it, comment on it. If you have a question, please ask it. The interaction benefits all.
Stuck in the Middle
A couple weeks ago Mr. Blonde posted Ripe for Relief and reaffirmed that view in late May (here). By all accounts various measures of risk relaxed since and focus shifted to how far the bear market rally might go. At the moment, we seemingly find ourselves stuck in the middle of a downtrend and approaching resistance as we’ve met average bear market rally criteria.
Mr. Blonde sees equity markets as having limited upside given his profit growth forecast (negative growth in 2023) and valuations that remain above average given macro conditions (inflation and Fed hikes). The one step forward two steps back mindset for markets remains and it’s time to start walking away from the recent rally.
To move us from the middle the market will need new information on inflation trends where softer readings can push us higher and higher readings are likely to bring back some rate volatility to send equity risk lower. But time is also a key now as we need to digest weaker growth and profit trends over the next couple quarters.
What is a Bear Rally?
Bear markets are a function of price, time and breadth. Over the last 50yrs there are only a few bear markets, so small sample size reduces ability to have high confidence in how it plays out.
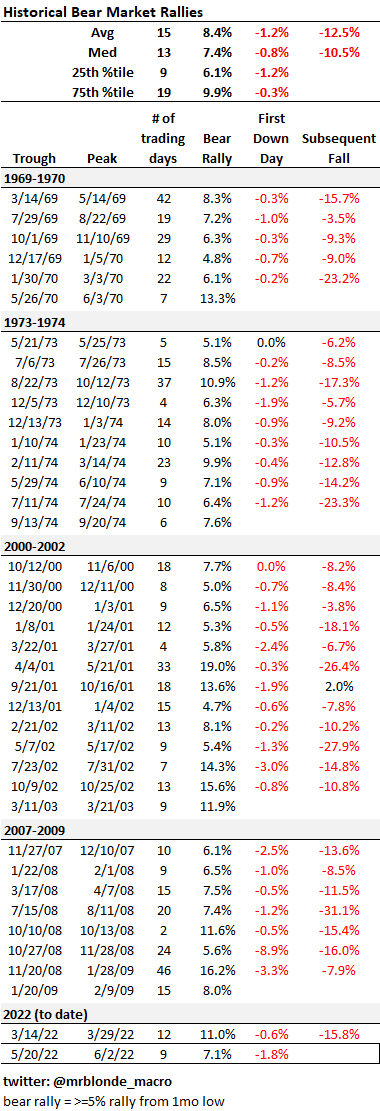
The table summarizes bear market rallies as defined as at least a 5% rally from one month low. The rallies are relatively frequent and often violent affairs lasting 13-15 trading days on average and delivering 7-9% counter trend gains at the index level.
Bottom line, the current rally of 7% over 9 trading days meets the average criteria of bear market rally and so we should look to dial back risk exposure. After anticipating relief, Mr. Blonde thinks it’s time to start walking away from risk.
Now What?
There are two clear risks on the horizon that can end the calm. A turn in rate vol and/or a pick up in negative corporate guidance into 2Q reporting season.
Quick recap of how we got here to help us understand what happens next. The relief came from lack of upward repricing in expected Fed rate hikes as faint signs of peaking y/y inflation, more signs of softening activity, and Fed suggesting 75bps might be more than necessary at the moment. Basically, the market got comfortable with the committed rate hike plan and as a result rate volatility faded and allowed equity valuation to stop compressing.
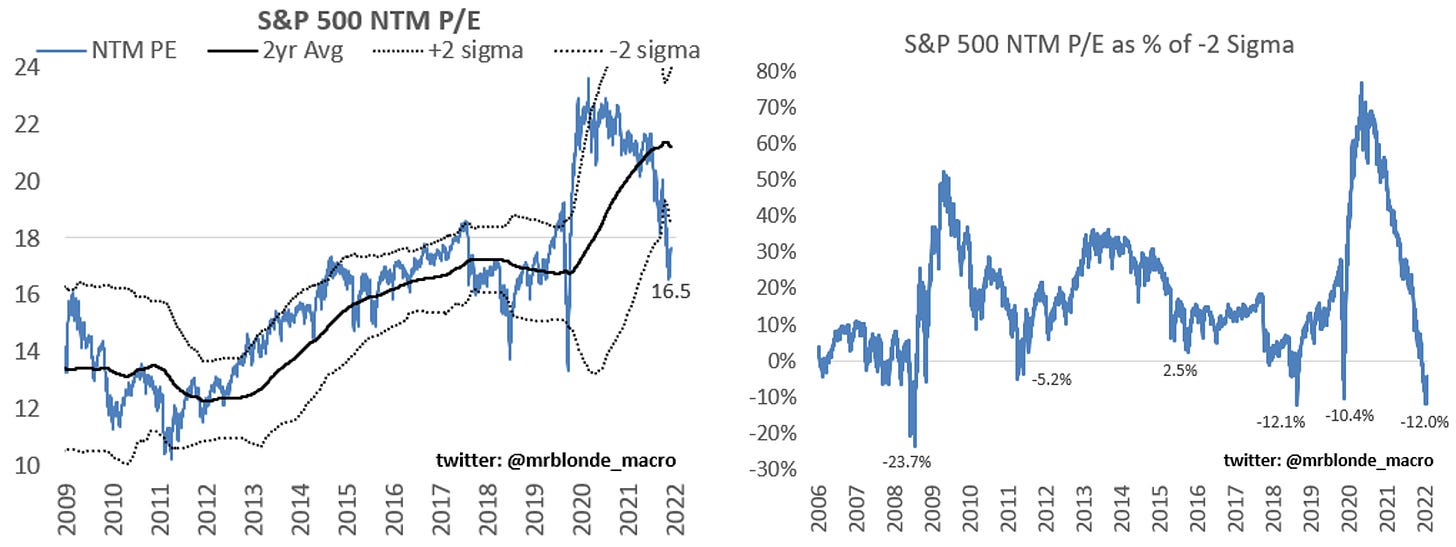
The equity valuation compression in the last 6mos is meaningful and now finds itself in pre-covid average range of ~15-18x. Is that too high? Probably given macro conditions of inflation and fed rate hikes, but its also come a long way from 22x late last year. Also notable, at least from tactical trading standpoint, is valuation undershot the -2 sigma band by an amount similar to past corrections which brought a pause in the pain.
It’s unlikely valuation can expand given the combined headwinds of Fed tightening cycle and negative earnings revision trends. In Don’t Fight the Fed, Mr. Blonde outlined what happens during Fed tightening cycle but importantly segmented fast and slow cycles to highlight important differences. This is a fast cycle.
But its not just the Fed, valuation compression is the norm when earnings revision breadth is falling too. The combo of Fed hiking into a profit growth slowdown has been a core view for Mr. Blonde since 4Q21.
The market focus and narrative is now transitioning From Fed Hikes to Growth Cuts. Profit growth is the oxygen that allows risk markets to breath. If it is in short supply, they are weak and slow, if it goes deeply negative, they die.
Mr. Blonde’s macro growth composite dipped into negative territory and given the long lead time of the earnings growth leading indicator suggests it will keep falling. You can read here how Mr. Blonde uses the growth composite when facing markets – it’s a key performance indicator.
But “GDP is good and the economy is not in a recession”. This is the dumb stuff gray haired strategists say that don’t actually take risk. We don’t trade GDP futures so don’t make that a big part of your risk taking investment case.
Brace for Impact
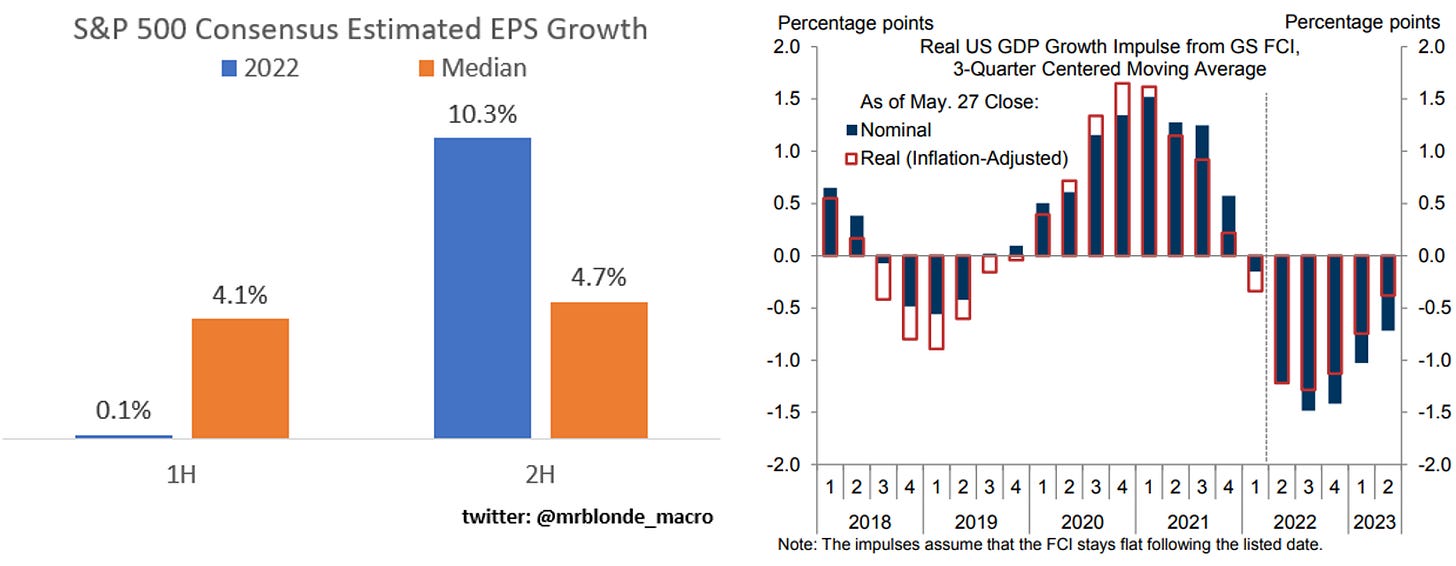
The market’s current expectations for 2H earnings growth appear wildly optimistic. Consensus forecasts call for S&P 500 EPS to growth 10% in 2H22 vs. 1H22, which compares to long term median of 4.7% 2H growth.
Not only is the expected growth way above seasonally adjusted 2H growth, but it flies in the face of a macro growth environment that will surely be weaker than 1H as the global economy digests the triple threat of tighter financial conditions, higher input costs and fading cyclical growth. The probability of negative guidance and EPS downgrades during 2Q earnings season is not trivial.
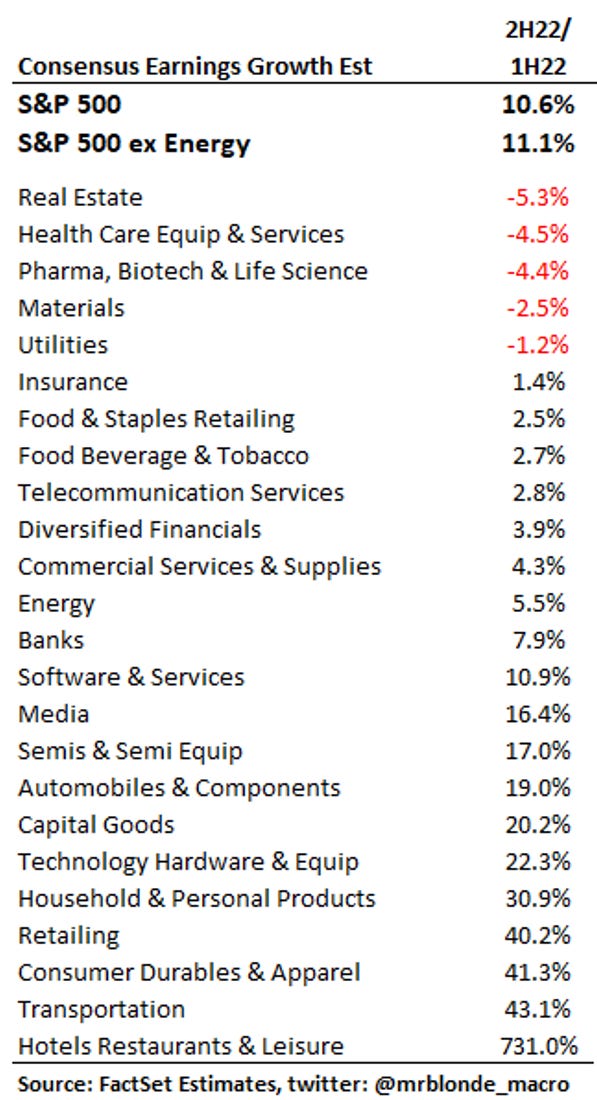
At the industry group level, consider some of the growth expectations here and ask yourself if this is a sensible forecast given the current and expected macro conditions. Hint: it’s not.
Its Just Math
The combination of higher cost of capital and flatlining-negative profit growth represents a significant headwind to equity markets. Mr. Blonde’s equity market valuation framework is fairly straight forward and presented in the table/chart below. Given the weak EPS growth forecast there is no upside for equity markets without a significant shift in cost of capital (i.e. lower rates for the right reasons) with current BBB cash credit yield of 4.7%.
Of course no valuation framework is perfect or precise, but can serve as a good guide and keep our emotions to a minimum. 15-20% downside to “fair value” is too much to ignore.
Are you gonna bark all day little doggie or are you gonna bite?
A few portfolio ideas Mr. Blonde is focused on.
SPY Structure for the Range
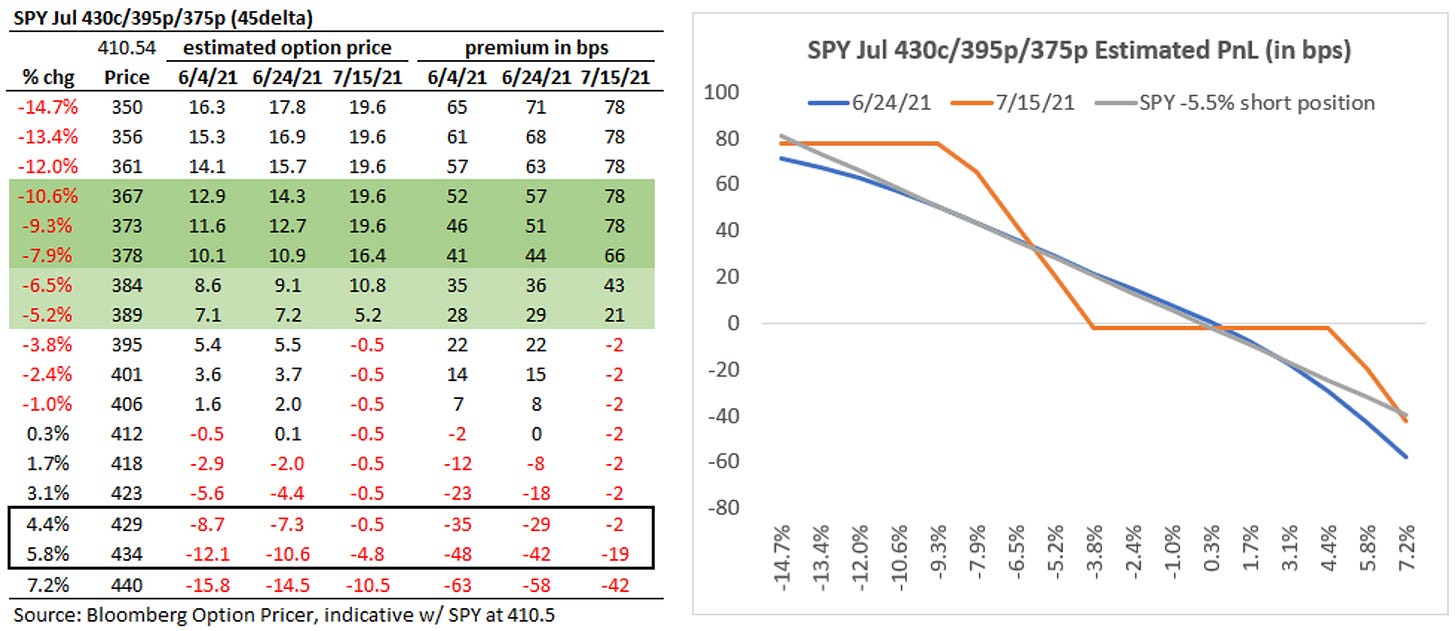
One way Mr. Blonde is dialing back exposure and walking away from markets is to add an SPY put spread collar, which is short 430c and long 395/375 put spread. Importantly this structure has unlimited loss potential in the event equity markets rally significantly above SPY 430 level by mid-July, so this is not for everyone and you need to assess your own risk tolerance. But this is a hedge with small upfront premium and fits the view that equity markets have limited upside and are vulnerable to taking ‘two steps back’ as we enter 2Q earnings season.
For sizing, Mr. Blonde is willing to lose 30-40bps in the even SPY trades to 430 by late June. At this position sizing, the structure is the delta-adjusted equivalent to -5.5% SPY short.
Still Like Buying Some Bonds
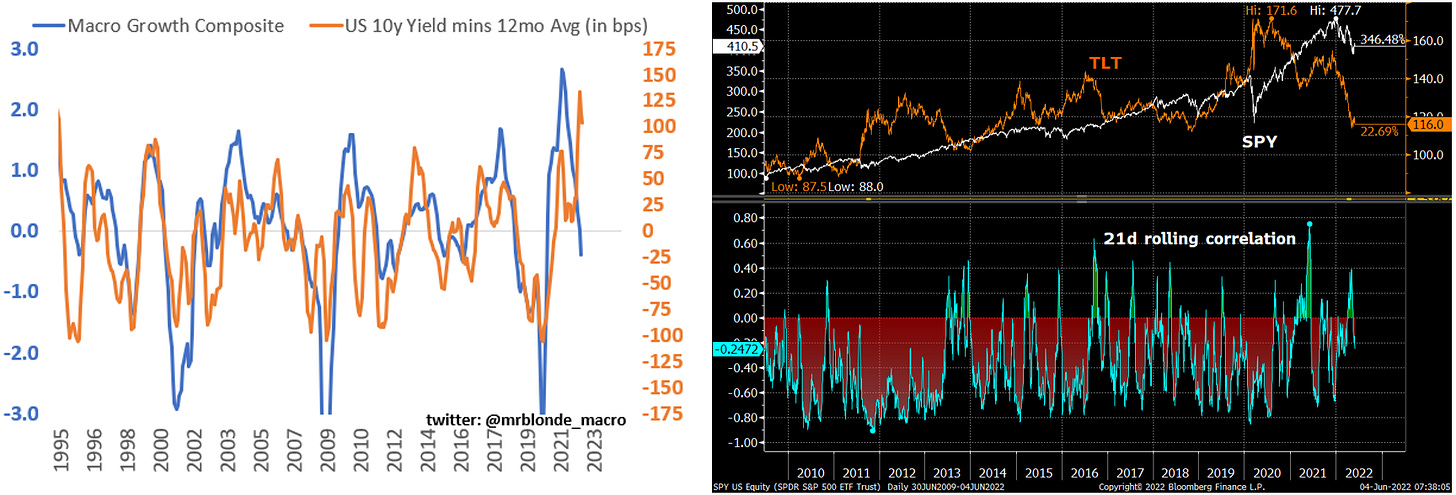
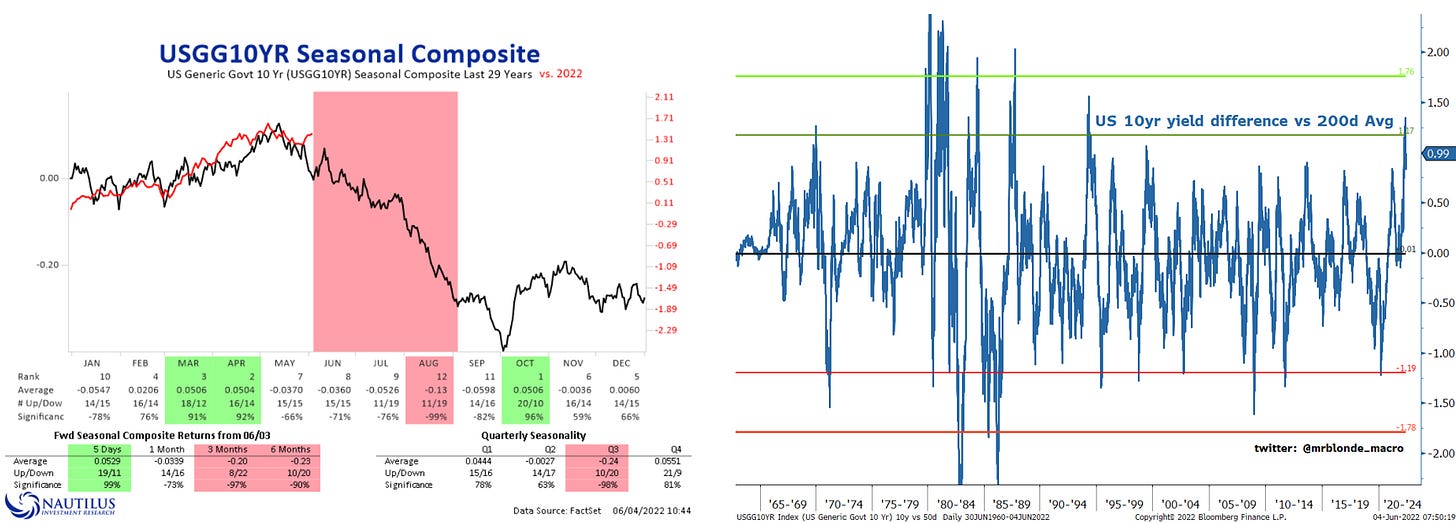
Since the end of March, Mr. Blonde has been looking for US 10yr yield to peak in the Apr-May time frame which is consistent with seasonality and fits his view that narrative is shifting “from fed hikes to growth cuts.” While far from perfect, the stall in yields in the last several weeks as well as the re-emergence of negative correlation between stocks/bonds gives some credence to the view. It’s likely to be a battle, but the divergence between yield levels and macro growth trends suggests the asymmetry favors lower yields at some point over the next 6mos. Time will tell.
Soft over Semis
Within equity markets, Mr. Blonde is looking for opportunities to buy beaten down growth segments that can find relative relief into 2H22 as the market concern shifts “from fed hikes to growth cuts.” During periods of slowing and eventually negative growth trends, equity markets typically favor high profitability, durable growth stories and focus less on the valuation paid for this growth security.
One representation of that is to be long software and short semiconductors, which historically moves with ISM manufacturing cycle (i.e. growth proxy). Without a doubt, the software sector was popular and correctly derated and derisked as it became clear the Fed was hiking us into a growth slowdown. But from here, semis carry increased risk as consumers pull back on durable goods spending and semi inventory levels are left vulnerable at time when sales growth is decelerating. If you wonder what this means, please see recent reports from WMT and TGT.
Meanwhile, the software group has acted better recently. Recent earnings reports from PANW, ZM, INTU, SPLK, ADSK, ZS, CRM, S, MDB, PATH, OKTA, and CRWD highlighted double digit sales growth continues and stock price performance of each outperformed the market in the days surrounding the report date – a healthy development relative to prior quarters.
Quality Compounders
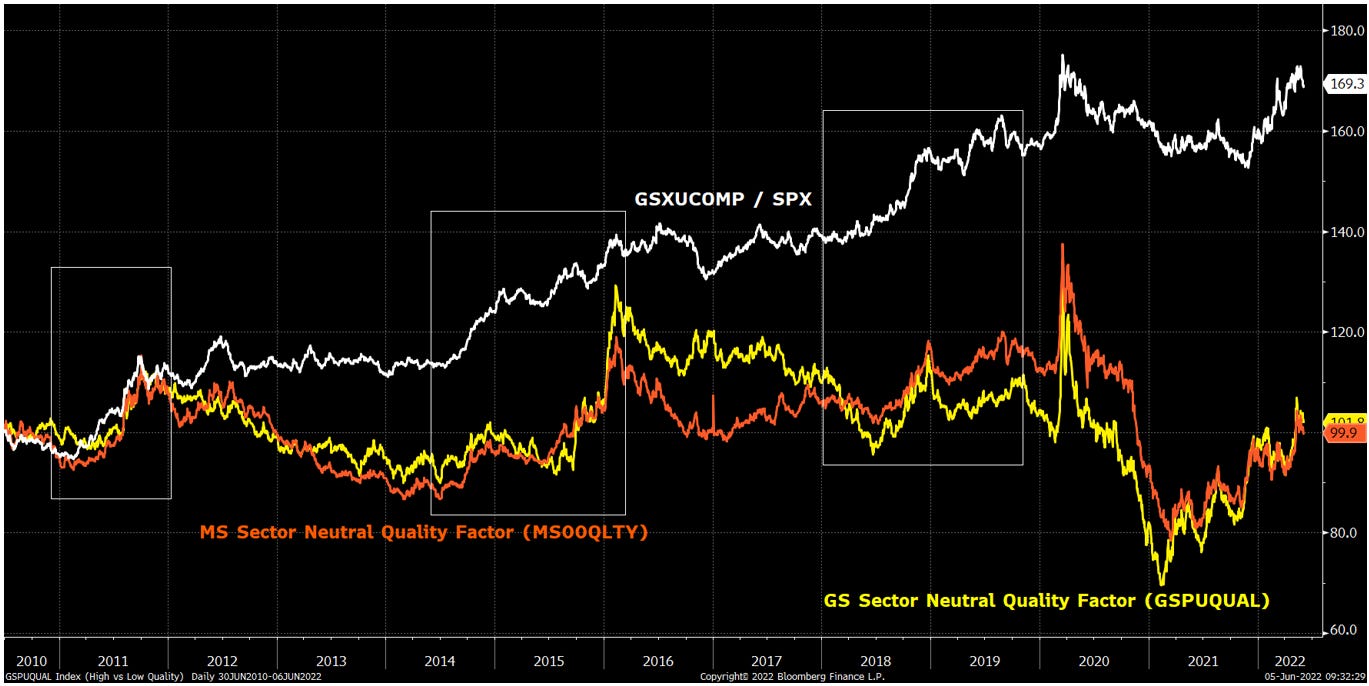
Kudos to Goldman Sachs for cracking the code on defensive compounders that outperform S&P 500, particularly during periods of strong performance from the quality factor, which Mr. Blonde has favored since 3Q22. Even more impressive is the GS basket (GSXUCOMP for those with institutional access) of 57 stocks has no exposure to the energy or financials sectors and still managed to beat S&P 500.
The selection criteria focuses on sales growth variance, profit margin level and variance, profitability, and FCF yield. Per GS, on average, the stocks in the basket generate 7.1% revenue growth and 15% earnings growth over the past 10 years (compared to S&P’s 5% revenue growth and 8% earnings growth) with high FCF conversion.
Mr. Blonde expects this basket to continue to outperform as market earnings growth continues to slow and ultimately dips into negative territory in 2023. See other similar periods boxed in the chart below, but outperformance cycles here typically last 12-24mos.
Stocks in the basket Mr. Blonde also owns include SPGI, MCO, NOC, LMT, MO, UNH, ABBV, EW, ISRG, COST, MCD, GOOGL, MSFT, ADBE, and VZ.
That’s all for now, thanks for reading. Please comment, like, share if you appreciate the work. Good luck trading your view. -Mr. B







Great work, really enjoyed this piece. Question - you mentioned in your “growing but slowing” article you’d do a deep dive into the Macro Growth Composite and each of its components. Are you still planning to do so? Would be really interested to learn more.
Even if energy pulls back a bit due to demand destruction (price or recession) are you in the energy is in a structural bull market camp?