Prior week’s gain was last week’s pain as nasty short squeeze in high beta cyclicals ensued. Mr. Blonde isn’t ignorant to price action, but important to put in context and evaluate outlook.
The view of slowing cyclical growth is unchanged and expanded on below. This week brings August manufacturing PMIs were downside looks likely and may serve as a reminder to those chasing high beta cyclicals higher. No Fed talking heads next week, but was Mr. Blonde the only one to hear Jay Powell agree with more hawkish members of committee and preview tapering later this year? Peak liquidity joins peak growth in 2021.
Last week wasn’t fun, but as they say…no pain, no gain. The precise timing of corrective price action is extremely difficult, but the window is open into early Oct keeping Mr. Blonde defensive and short biased for now.
Stressful Stress
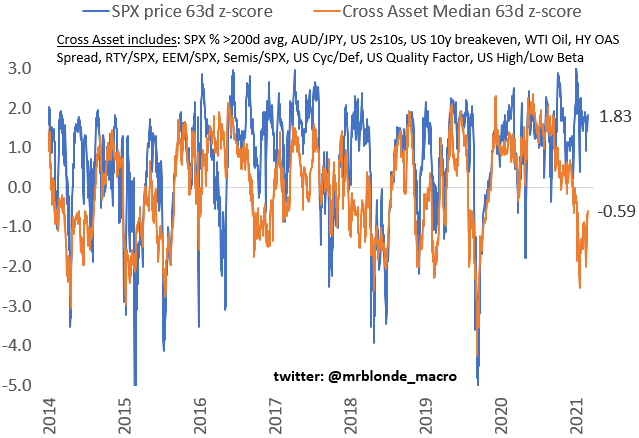
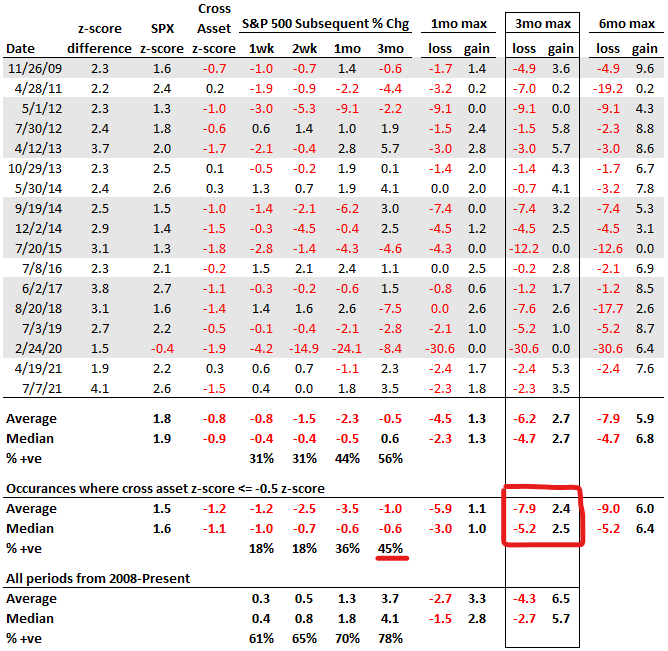
Cross-asset divergence with S&P 500 remains wide despite some recovery across markets last week. While the improvement raises doubt, it does not negate the signal from mid-July. In fact, similar improvement in cross-asset z-score was experienced in Aug’18 just before a significant setback across markets. Late 2018 was a period of slowing cyclical growth momentum and Fed policy tightening…sounds familiar.
A brief reminder: the signal from cross-asset weakness leaves S&P 500 vulnerable in a subsequent 3mo window which current extends into early October. The window coincides with seasonally weak time of year and a Fed signaling peak liquidity.
The Charts
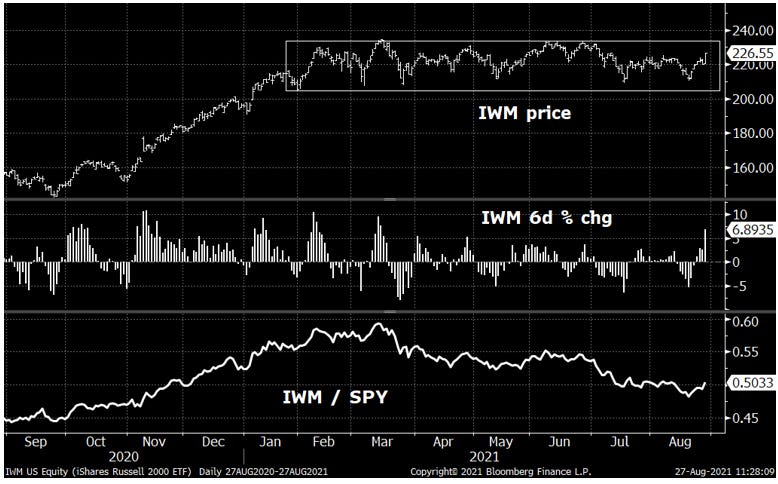
Russell 2000 (IWM)—a measures of cyclical high beta risk—just rallied 6.9% over 6 days, but remains within 6mo trading range. And in a downtrend vs. higher quality S&P 500. Despite last week’s rip, hard to say at this stage much changed in this measure of ‘risk.’
Small cap, high beta cyclicals benefited from a broad short squeeze across markets. Name your narrative, or like Mr. Blonde, see this as a bump along a downward path.
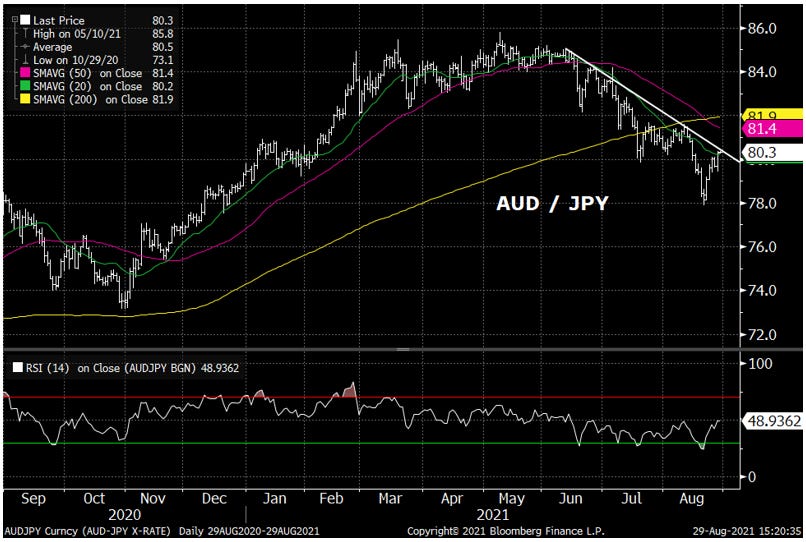
AUD/JPY looks similar…hard bounce into downtrend and short-term moving averages with clear negative momentum.
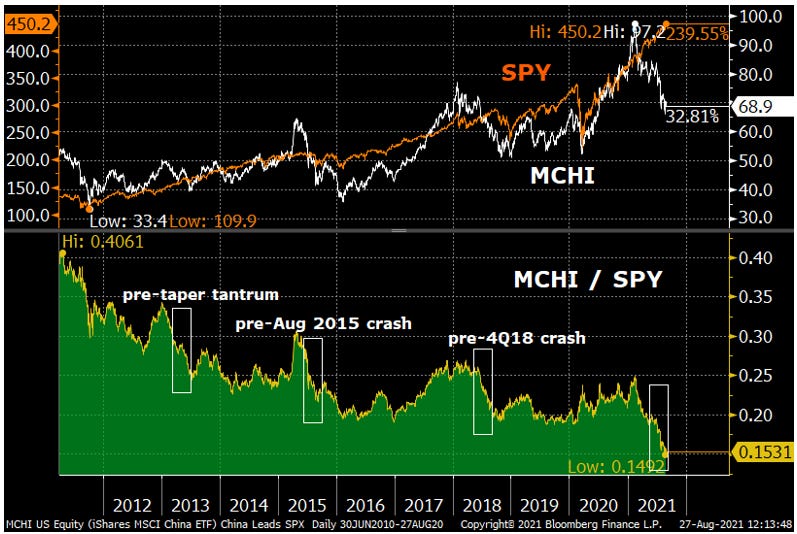
Chinese equity markets (MCHI) continued to lag S&P 500. China remains a source of opaque risk in the midst of deleveraging and heavy-handed regulatory crackdown. Anyone notice the crash in iron ore prices (-40% in last 6wks)? Coincides with the crash in China Evergrande credit. Property sector is the single largest contributor to China’s GDP. Its also likely a significant contributor to the wealth gap that Xi Jingping is looking to take down. Historically such periods were precursor to bigger moves in global markets.
Cyclical Growth Hangover
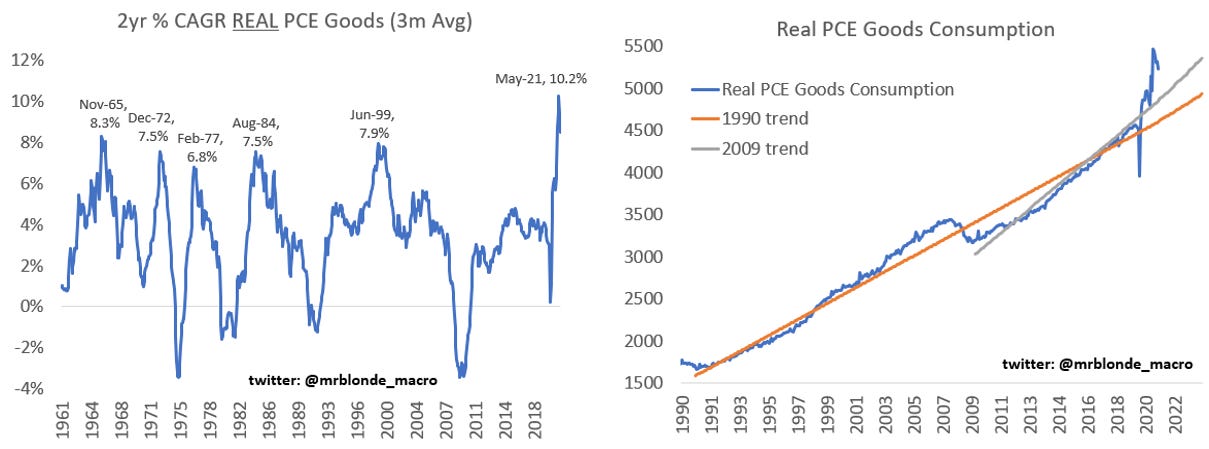
China credit impulse and lagged effects of rising 10yr yield were noted in earlier post. Also noteworthy is the risk of payback in quantity of goods consumption after record breaking growth to leave the category well above trend. How many dishwashers, refrigerators, sofas, bikes, TVs do you need?
If we revert to 2009 trend then real US personal goods consumption falls 3.5% by Sep’22 and falls 11.5% if we revert to 1990 trend. In both cases, the decline will be worse if we revert to trend sooner.
But Mr. Blonde they say growth levels will stay high. Maintaining the record pace of growth is almost impossible to imagine and risk of air pocket high when we think about how much demand was pulled forward. Goods consumption is an important factor in manufacturing activity.
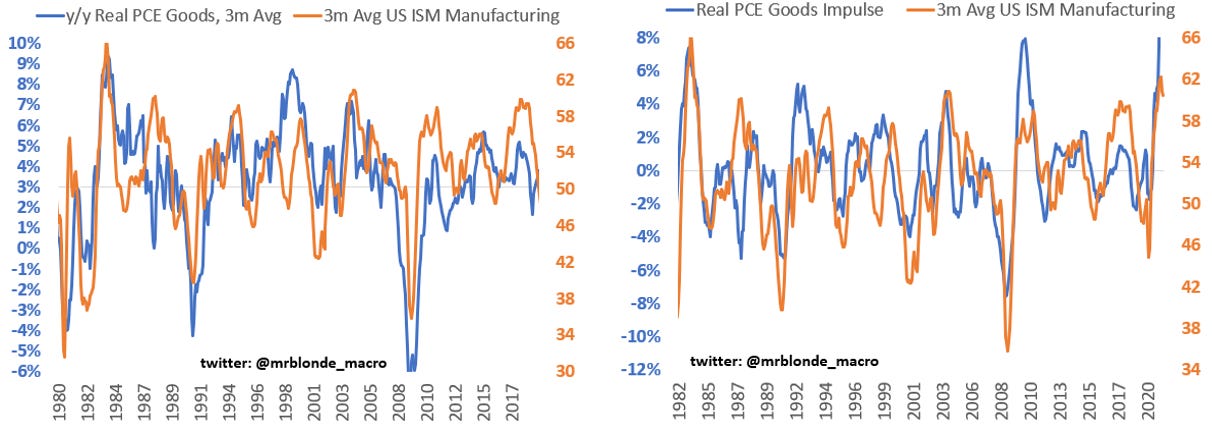
Historically, the direction of y/y real US personal goods consumption correlates with ISM Manufacturing. Even more important is the impulse of goods consumption (i.e. 12mo change in 6mo average y/y real PCE Goods) and ISM level.
Mr. Blonde believes this negative impulse is already underway and will continue into 2022.
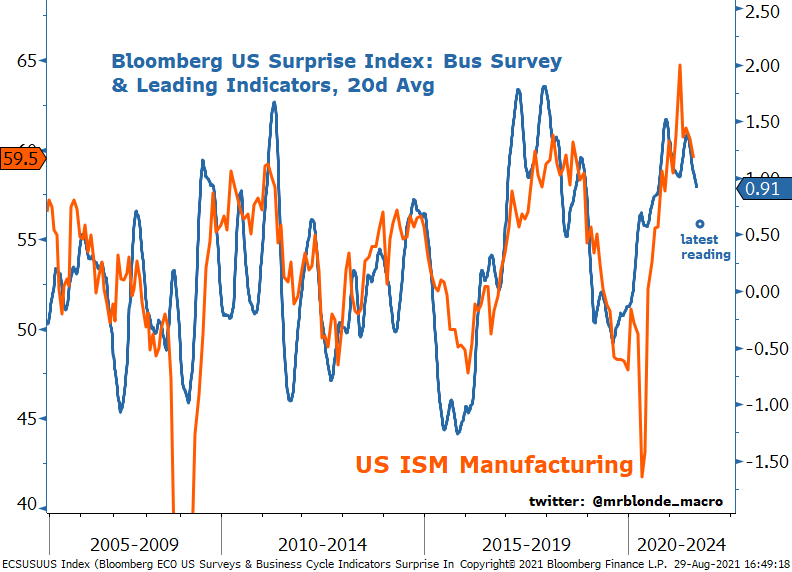
Anyone notice the big whiffs across regional PMIs in the month of August? Or no improvement in UofMich sentiment survey? Or sizeable downtick in NAHB Housing Sentiment? Historically, when results in the business survey and leading indicator category are missing expectations it indicates we are entering a down cycle in cyclical growth momentum (i.e. falling ISM).
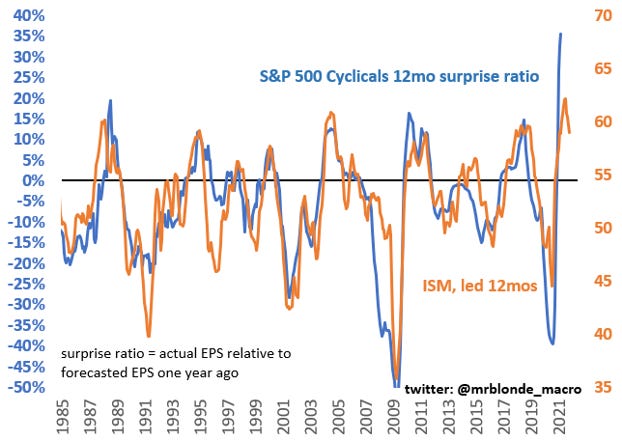
The reply often goes something like, “falling ISM, big deal…growth is good.” Rate of change determines the trajectory of expectations and cyclically sensitive asset prices. Historically, falling ISM is a strong leading indicator for fewer and potentially negative earnings surprises across cyclical groups. Picture is worth 1000 words.
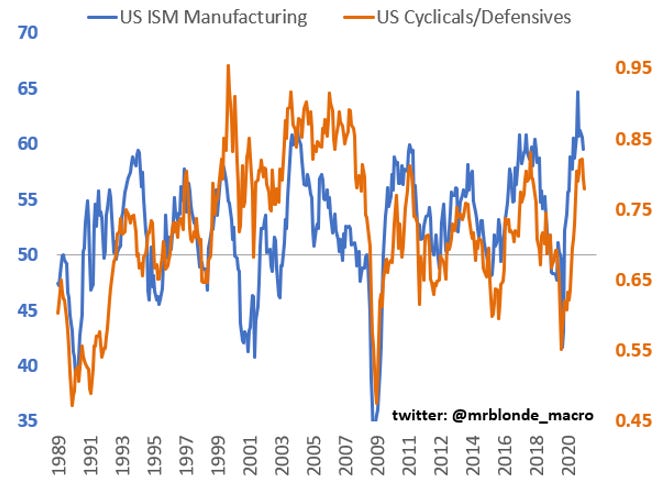
And so, when ISM falls, cyclicals underperform defensive equity groups. Of course, there is a scenario for ISM to stay in mid/high 50s. But even in that scenario the risk/reward of being long cyclicals and short defensives is a low sharp trade and likely suffer first. At best, it causes for less cyclical, lower beta equity portfolio.
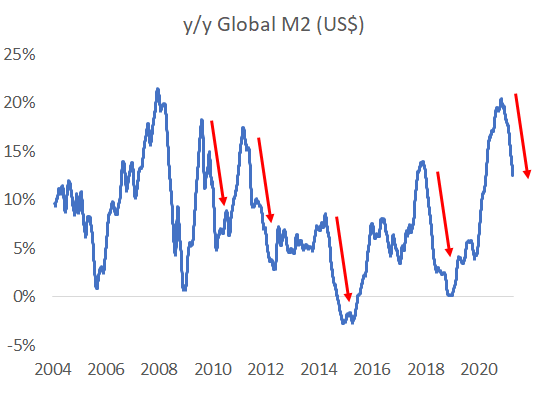
Oh…and all of the above is happening as Fed reduces asset purchases (i.e. peak liquidity). No need to debate M2 construction, historically periods of falling M2 growth are less favorable for equity risk/reward than periods of expansion.


Stay Defensive and Up in Quality
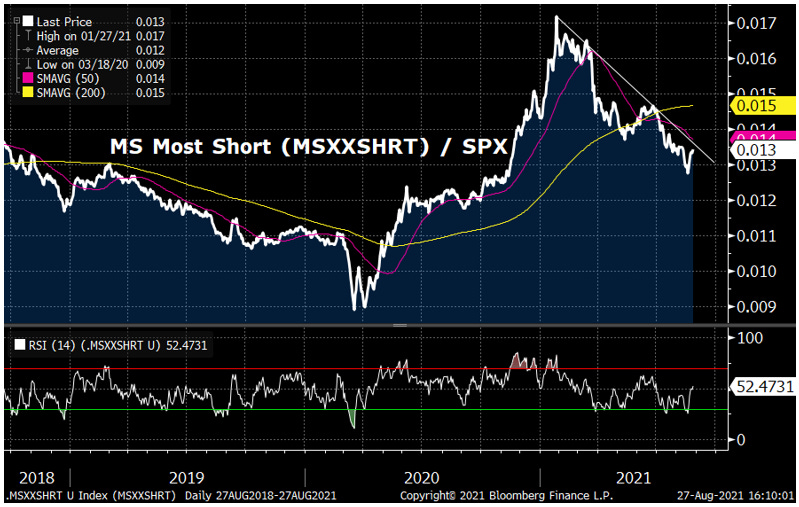
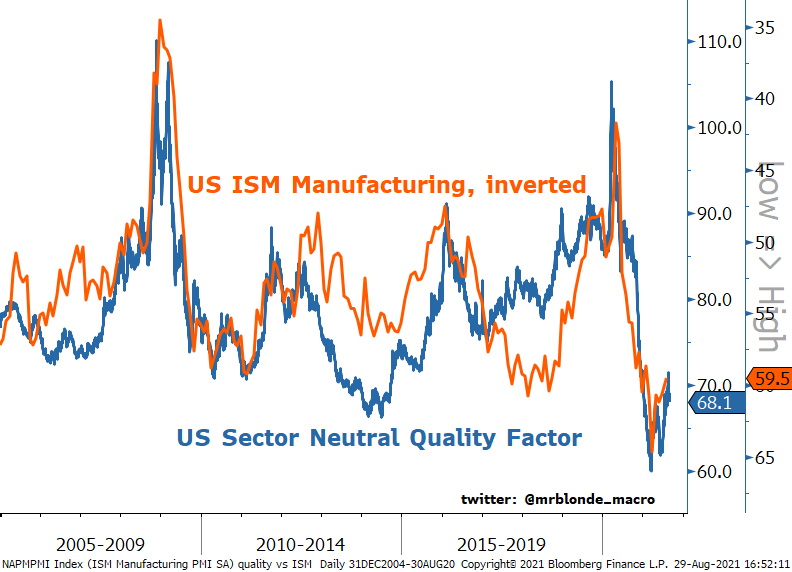
So despite last week’s punch in the face, Mr. Blonde is sticking with the plan and maintains a defensive/short bias. Continue to see long quality and short risk (i.e. small market cap, high beta, high balance sheet leverage) as an attractive trade for growing but slowing environment.
Still long September put protection with view negative growth surprises will be more of a challenge for risk as Fed moves forward on tapering. And respect the signal from cross-asset divergence which triggered in mid July during a time of seasonal weakness.


