Last call! This will be the last free for all commentary. After today a monthly subscription will be required. See here for details and expectations. Hopefully after reviewing content provided over the last year you will find it well worth the price.
Consistent with call for a Bear Bounce a month ago, equity markets are up in three of the last four weeks and +8% in Oct. Some had the guts to participate, many fought it, naturally the question is what to do now?
The knee jerk reaction is to sell into the FOMC meeting this week where they are unlikely to placate “pivot” dreams. Mr. Blonde expects FOMC message will stay consistent and suggest rate hikes will continue until realized inflation falls to a manageable pace and level. Don’t expect any pre-commitment on magnitude of rate hikes and continue to keep options open. All told though, that message from the Fed is not really new…its more of the same.
Following the last few weeks, Mr. Blonde finds himself with a more neutral tactical view and expects price action will exhibit more two-way risk from here. Its sensible to reduce tactical long exposure put in place a month ago, but not yet ready to go hard in the other direction. 2022 has been a year to sell rallies and buy dips…while expecting bigger dips.
A few charts and thoughts supporting that viewpoint:
FOMC First
There are plenty of people to pontificate on the Fed…for some it’s sadly a full-time job. Inflation momentum peaked and inflation is likely to stay an important debate in 2023, but its too early for the Fed to declare victory and they are likely to choose to do too much rather than not enough — the cost associated with a “late and fast” policy strategy.
Mr. Blonde is sure the Fed is happy about the early signs of slowing inflation momentum, but they are unlikely to ease off the brake until they are confident inflation is coming down toward target. Perhaps a discussion for 1Q23.
Nothing Wrong with Neutral
Expect S&P 500 price stalls around 17.5x forward P/E, which currently equates to ~4075 (or +4%) based on consensus EPS of $233 (and falling) for 2023. Why 17.5x? Historically, valuation multiples compress as long as the Fed is hiking rates (yes even if hiking at slower pace) and rolling 1yr average acts as an area of resistance.
Bottom line, Mr. Blonde feels tactically neutral at current levels with a core view that remains defensive. Shorting the FOMC meeting feels a bit too obvious, but chasing a +10% moves has not been rewarded this year. Sometimes it’s best to sit back, observe and wait for direction.
Technicals & Tactics
The short-term technical backdrop has improved quite a bit recently and another 4% is not out of the question. Such a move would put SPX ~6% above its 50d average and likely leave +80% of stocks above their 50d average—both on par with mid-Aug highs. Given the deterioration in fundamentals since then such an outcome strikes Mr. Blonde as a bit much without a genuine shift in Fed thinking, which also seems unlikely.
Systematic Support
A primary driver of the early August move higher in stock prices were systematic strategies which turned buyers (short covering) in an environment to low/no trading liquidity. This remains a positive risk factor today and if we get that +4% move in S&P 500 its likely this group is a key contributor—a wild card.
Mr. Blonde has yet to find a clear and definitive measure of CTA exposure or timing signal, but most across the street agree the group is near max short, covering and is a buyer higher. This could be a swing factor later this week and something to keep in mind.
Its Earnings Stupid!
Technical rallies driven by positioning and sentiment are a feature of bear markets (here). They are confusing, frustrating and often defy logic. They are typically violent and can inflict significant damage to unprepared portfolios. But they are also short lived, counter-trend affairs and then the market reverts to trend. While this bear market rally may have a bit more life, the trend remains negative as EPS trends are now clearly negative and represent a stiff headwind.
Mr. Blonde previously shared his view of rolling changes in NTM EPS and its influence on market returns. This table serves as a reminder that periods of falling NTM EPS are typically a bad backdrop for equities with average 3mo returns of -3.7% and positive returns less than 40% of the time, both significantly below average. Selling rallies is a favorable strategy.
Paid to Wait
Moving to a neutral position is far less punitive than it used to be. US 6mo Tbills now offer 4.5% yield which is quite competitive vs. the equity earnings yield or even US BBB corporate cash credit yield of 6.5%. This is a meaningful adjustment within capital markets and one that is likely to be felt over the course of several quarters as multi-asset managers gradually, but consistently, shift towards no volatility, modest return offered by cash.
Regime Relative Performance
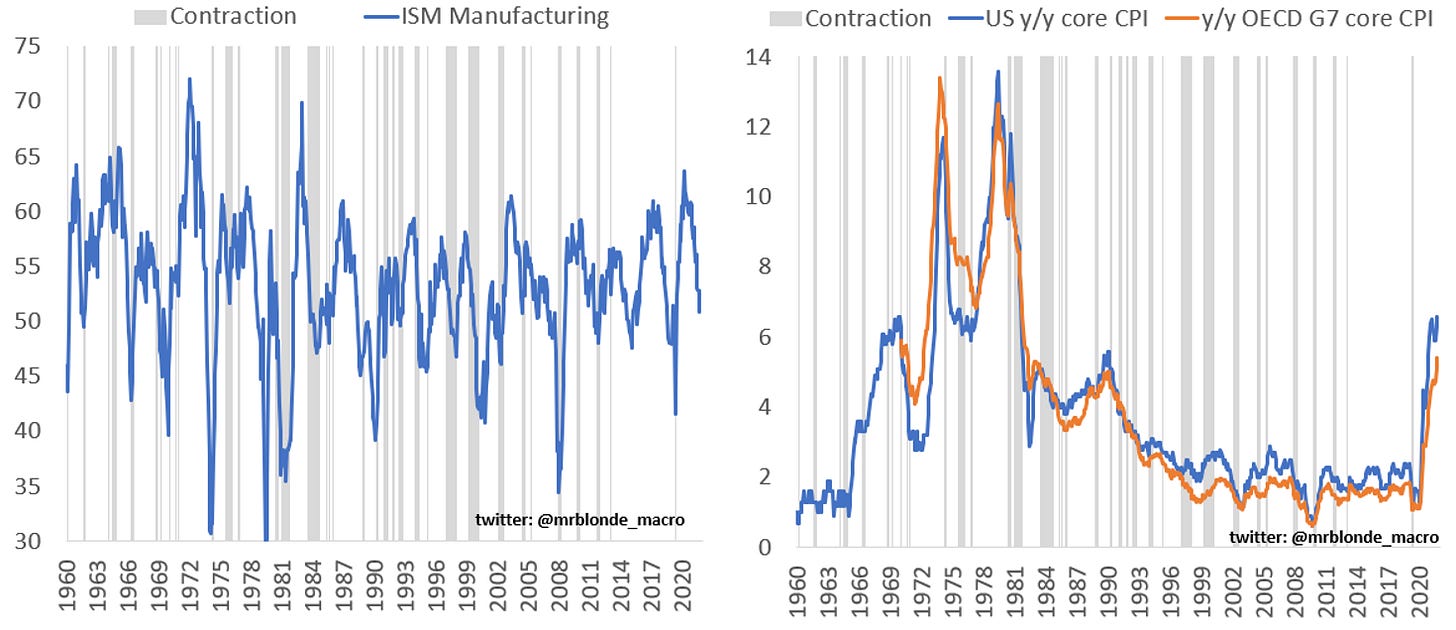
In early March (here), Mr. Blonde provided a framework for which parts of the market to focus on in an environment of falling ISM and rising y/y core CPI. Such analysis serves as a useful guide on where to spend time on both the long and short side. Its not a black box model, but a regime roadmap to guide judgement.
In March the focus was on how to trade for “stagflation” regimes as rising inflation in the face of falling growth momentum is a unique circumstance for most of the last 30yrs. Growth momentum (i.e. ISM) is still falling and y/y core inflation is still rising, but 6mos from now its probable y/y inflation momentum will be coming down alongside growth.
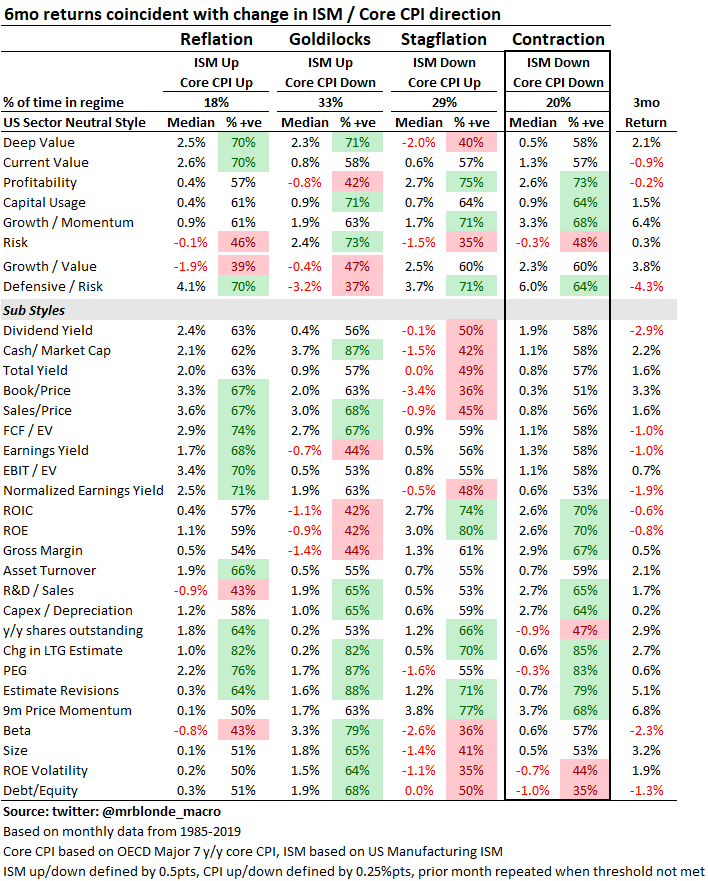
The table outlines different regimes of ISM and y/y core CPI momentum with coincidental relative performance of various US industry groups. Historically, “stagflation” suggests the worst environment for broad markets with lowest return and probability of positive performance (% +ve). This eases somewhat when y/y inflation also starts to fall as it likely gives scope (hope) for central bank support to enter the discussion.
“Contraction” environments favor outperformance of pharma & biotech, real estate, utilities, consumer services, food/beverage/tobacco, media and telcom services…many which overlap with “stagflation.” Underperformance in materials, autos, banks, consumer durables and transportation should continue.
Bottom line, the historical and expected regime continue to favor defensive group allocation within equity markets. And since the majority care…energy is still positive, but exhibits more relative performance volatility than other groups.
Stock pickers should study sector neutral style factor returns across the same macro regimes. Unfortunately, detailed style factor returns are not widely available beyond the mid-1980s so we miss some extreme high inflation periods, but still capture rate of change, multiple environments, and the results are rational.
The current and expected environment favors a mix of profitability, price momentum, low risk and current value (i.e. FCF/EV).
Please see below for more detailed explanation of sector neutral style factors.
Are you gonna bark all day little doggie or are you gonna bite?
A couple trades and ideas on Mr. Blonde’s mind along with a relevant idea screen for the stock pickers out there.
Sell Rip, Buy Dip Structure
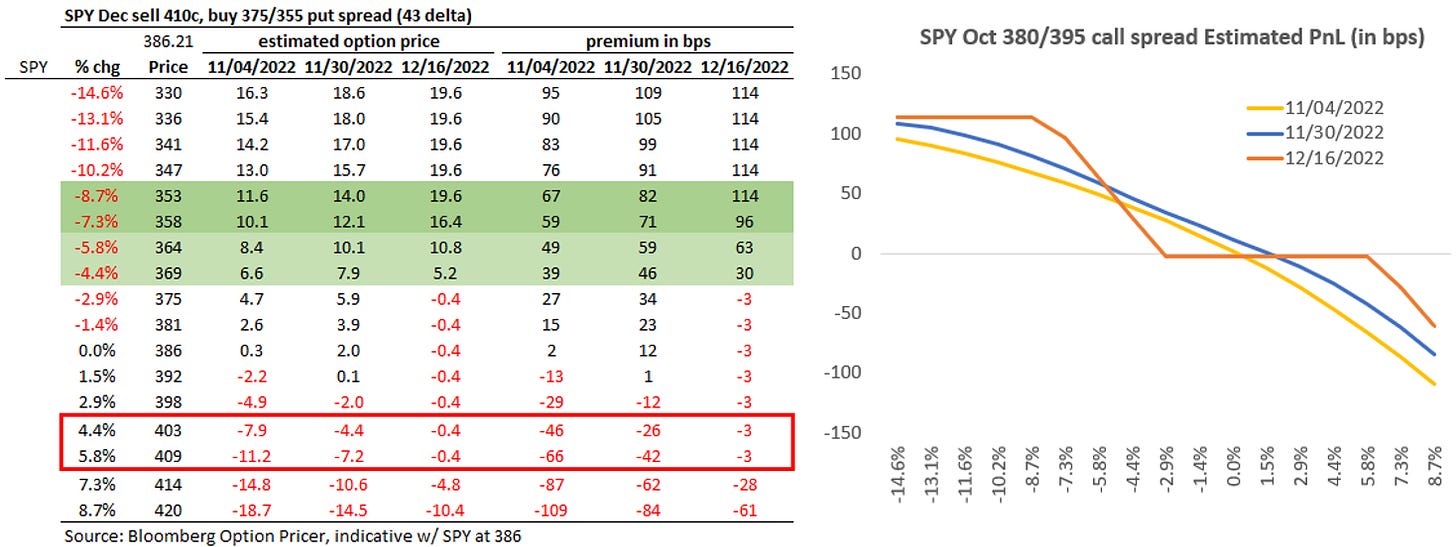
Mr. Blonde has his eye on SPY put spread collar to dial back risk and take advantage of the recent bear market rally. This structure is not for everyone and can deliver painful mark-to-market PnL in the short run, but it fits Mr. Blonde’s view on time and price. Sell SPY 12/16 410c to buy 375/355 put spread for close to zero cost.
Note the payoff profile and risk associated with short term up moves. Do your own due diligence.
MOJO Rising
Long side of momentum currently has the right characteristics and sector exposure for the environment. Technically the relative price chart has broken above its down channel and momentum has momentum.
MTUM etf is currently overweight energy, pharma & biotech, food/beverage/tobacco, and health care equipment & services. It is underweight software, media, retail, banks, tech hardware and semis.
The style factor attributes of MTUM are more interesting with outsized exposure to profitability, price momentum (duh), low risk and FCF/EV so current valuation is close to neutral.
Taking it to the Stock Level (h/t: HM)
The below screens leverage the regime work above to filter the US large cap universe across groups historically favored during periods when ISM Manufacturing and y/y core CPI are falling.
The style factors here are sector neutral and represent the cross-sectional z-score for each metric where higher reading represents of the fundamental exposure. For example, +1.0 profitability reading means the company’s profitability is +1.0 standard deviations above the sector average.
The screen here is purposefully large and threshold criteria loose so stock pickers can go to work. Not every stock on the screen will outperform, but on average you would expect they perform better than the market and better than their respective sector.
The list is sorted by industry group and then descending by its profitability score.
This screen uses the same criteria as above, but is not filtered for the groups that typically work during periods of falling ISM Manufacturing and y/y core CPI. These are the remaining companies that met the style factor criteria irrespective of their sector classification.
Sorry for the long post, the regime work should probably be its own post but thought important to provide context on internal opportunities as well. Will follow up on this work in later post with more detail by period and executable ideas.
Good luck trading your view.
Sector Neutral Style Factors
Sector neutral factor exposures reflect cross-sectional z-score exposure for various fundamental factors. For example, +/- 1.0 Profitability reading suggests companies profitability is 1.0 standard deviations above/below sector average.
Style factors are rebalanced monthly from a US large cap universe (~1200 companies).
composite style factors and sample of inputs:
Deep Value = price/book, price/sales, cash/market cap
Current Value = forward p/e, trailing p/e, FCF/EV, EBITDA/EV
Profitability = gross margin, ROE, ROIC, ROA
Growth / Momentum = 9m price momentum, earnings revisions, long term growth estimate
Risk = beta, size, debt/equity, ROE volatility


Excellent analysis. This is why I'm a paid-subscriber. I appreciate the ETF idea (MTUM), stock screens, and sector-related discussions that assist long-only investors like me whose eyes glaze over from put spread collar talk.
Mr. Blonde is a legend, although some is over my head, the directional calls are golden.