It’s much easier to make a buy call on low/no positioning than it is to call the top on high positioning, but its also critically important to keep tabs on positioning when evaluating risk. A look across multiple measures of positioning raises an eyebrow and suggests bearish ‘talk’ is inconsistent with how the market is positioned.
We appear to have a market of near fully invested bears which is dangerous if people start acting on their feelings. And begs the question…who’s left to BTFD?
Over medium-term view (>6mos), the lack of return generating investment opportunities is a tailwind for high quality equity markets, like S&P 500. But on shorter time horizon (<3mo) corrections happen for a wide range of reasons. Mr. Blonde still sees a fragile market with high beta risky segments lagging, breadth narrowing, positioning elevated and in a seasonally challenging time of year. This view is not new, but it hasn’t improved either.
Short-term Seasonals
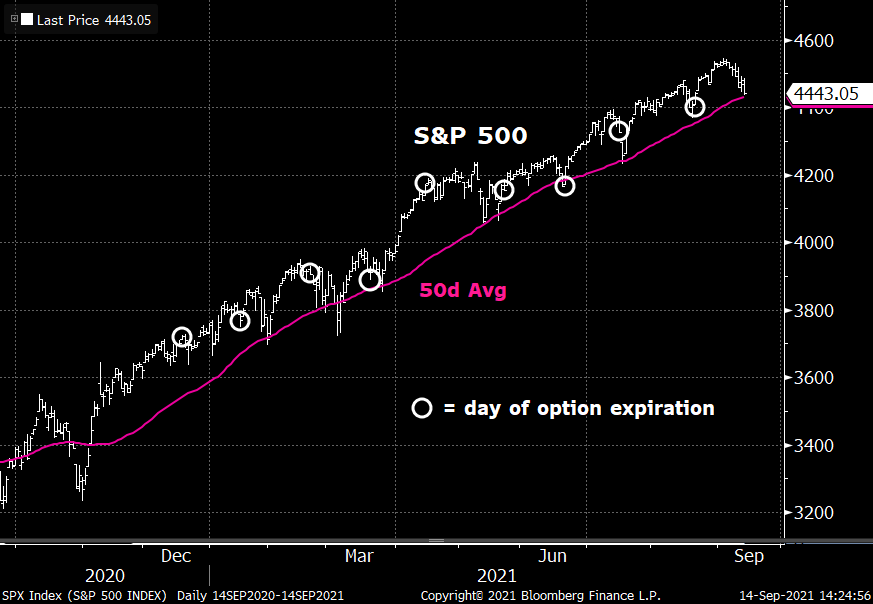
Most are now aware of the “gamma apes” and how they trade around option expiration. Year to date, the 5 days preceding option expiration are certainly weaker — SPX -0.7% on average. The pattern seems a bit more consistent recently with the local low in S&P 500 occurring on day of expiration, near 50d average and rallying after (+1.1% 5 days after, on average).
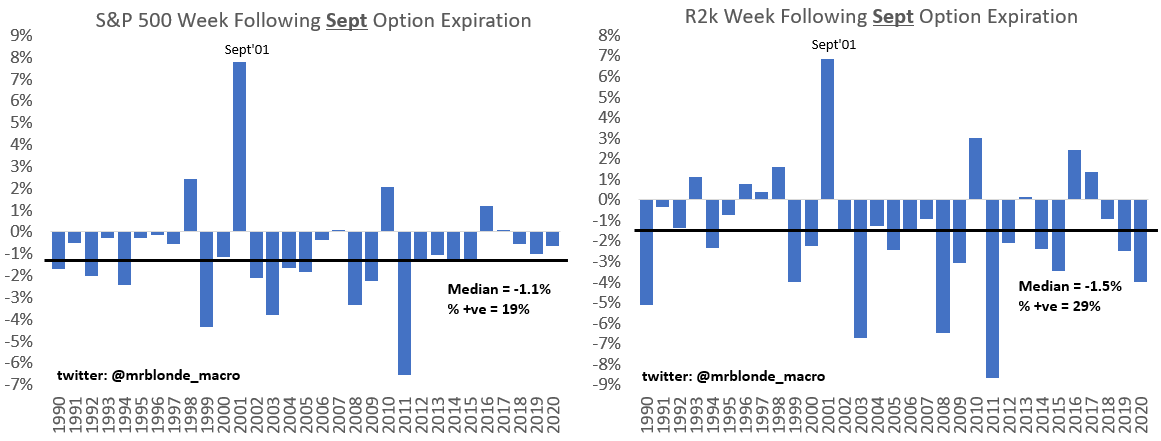
But next week recent seasonals collide with storied seasonals. The week following September expiration is the seasonally weakest week of the year. Can this break the recent post expiration rally pattern? Maybe. This year the week includes an FOMC meeting, which have not exactly been risk on events under Powell’s leadership. Mr. Blonde is positioned for more weakness.
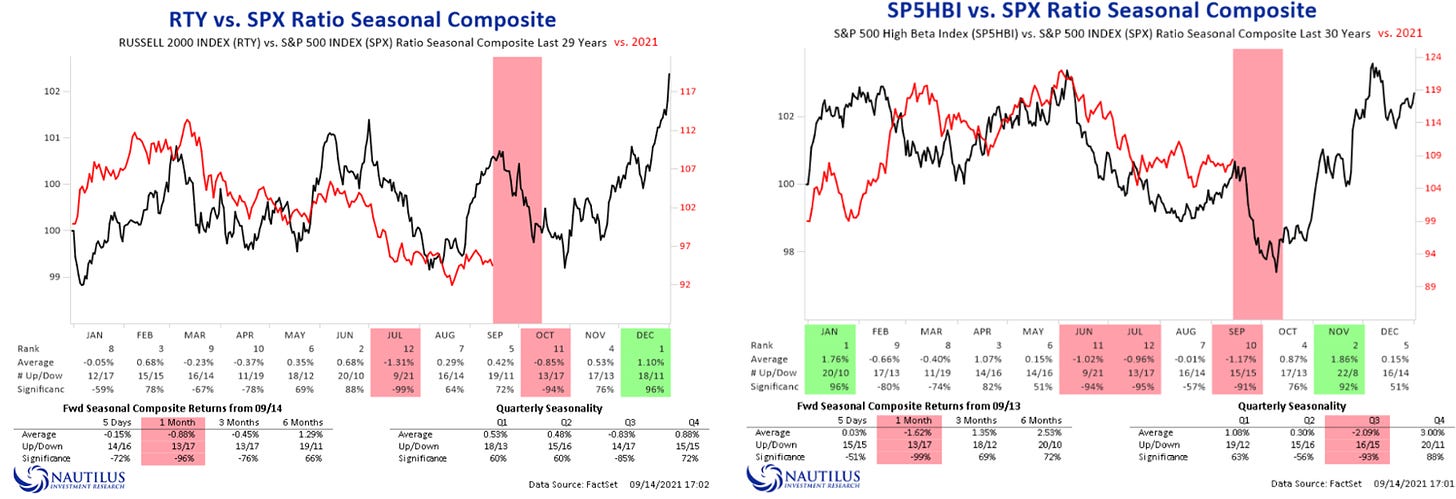
We observe seasonal weakness in high beta, low quality slices of the market as well over the last 30yrs. h/t @NautilusCap for the seasonality charts to make it clear and easy to produce. The next month tends to be a period of “risk off.”
Positioning in Pictures
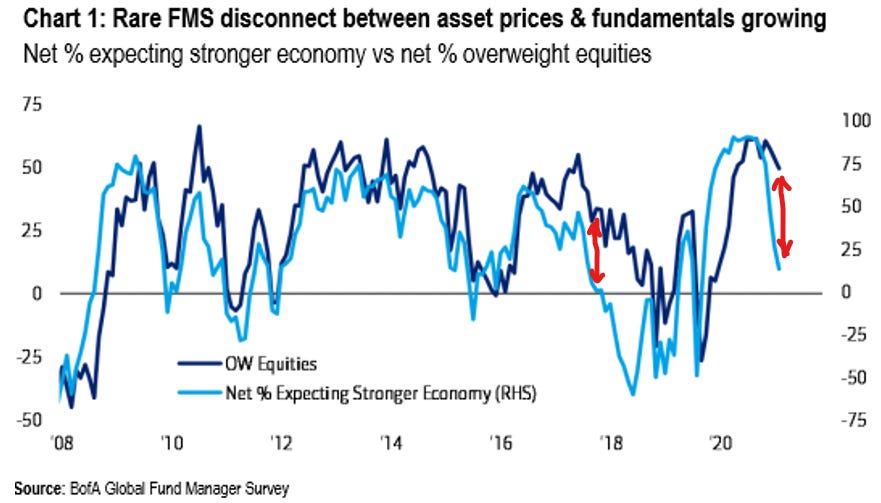
From the BofA/Merrill Global Manager Survey we see a smaller % of equity investors expecting a stronger economy but their equity overweight is little changed. A similar divergence between sentiment and action was in play during late 2018.
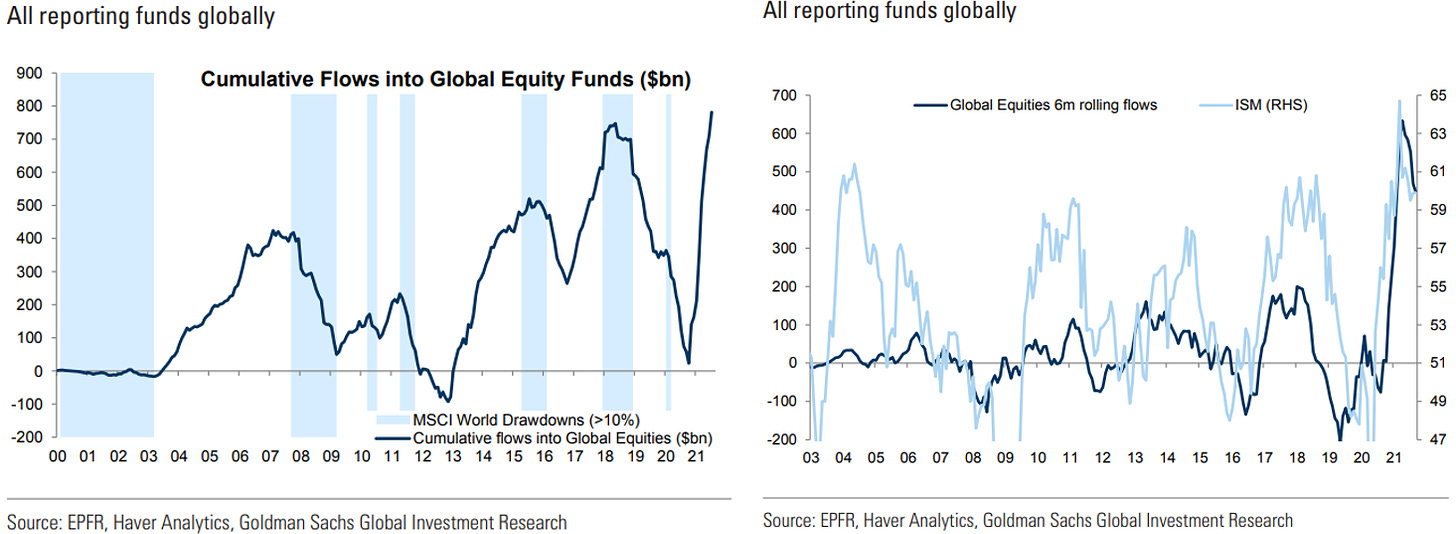
Sticking with long biased market segments the magnitude and speed of equity fund inflows borders on unprecedented. It would be preferred if these flows were normalized by equity market cap, but the current period would still catch your eye.
Despite all talk of Fed equity market manipulation, flows follow the rate of change in fundamentals. Money comes in when ISM rises and the pace slows significantly when ISM falls.
Open for debate, but today’s inflows can be tomorrow’s outflows. The level of participation has really broadened in the last year and when we have some real volatility we will test those diamond hands.
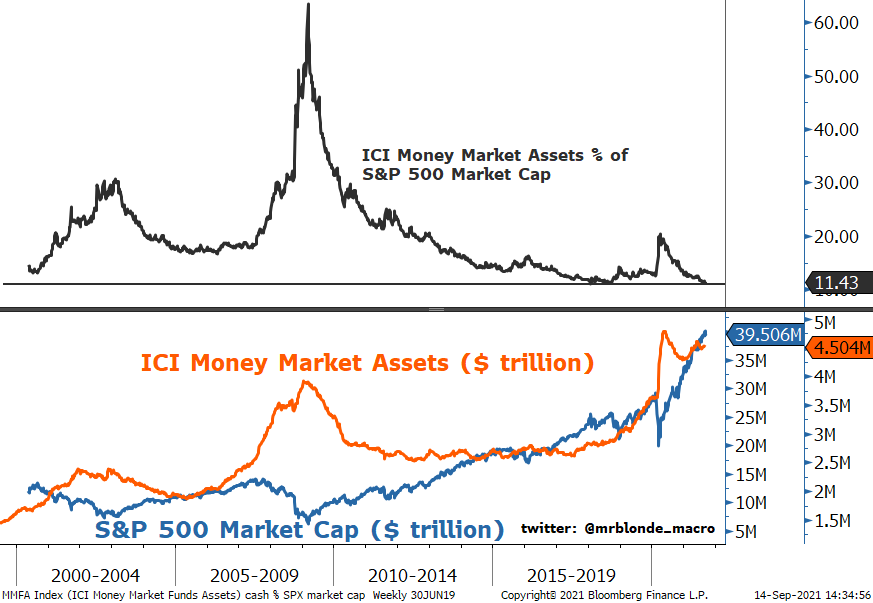
“But Mr. Blonde there is cash on the sidelines?!?!?” Sure there is cash on the sidelines (there always is), but when normalized for asset market value it appears risk takers have far less cash on hand than normal. Cash levels are high in nominal terms…like everything.
Mr. Blonde suspects more cash is held because other parts of safe fixed income represent “returnless risk”. Better to have cash on hand to buy stuff that breaks then bother with <1.5% US 10yr yields.
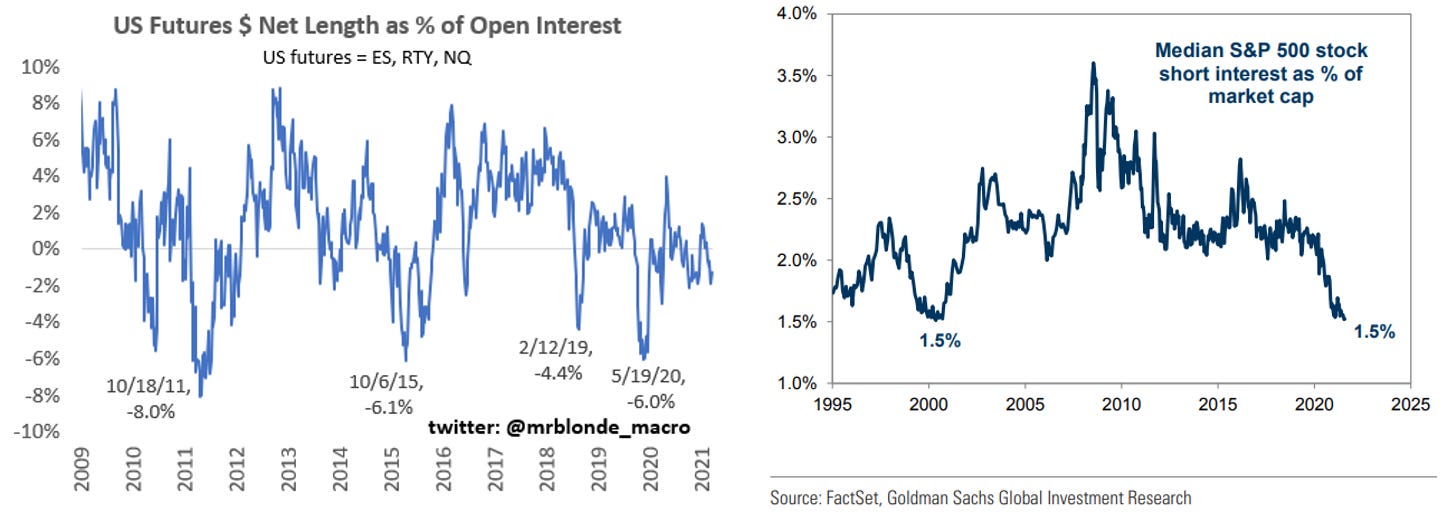
Shifting to equity long/short hedge funds (the marginal trader) we see net long exposure at decade highs and stalling. This length is complimented by the highest levels of gross exposure in a decade. The combination is the definition of leveraged long.
Short on shorts. Markets obsess over put/call ratio, skew in options market and high level of pessimism. But maybe this activity is simply just a rental given the lack of short exposure.
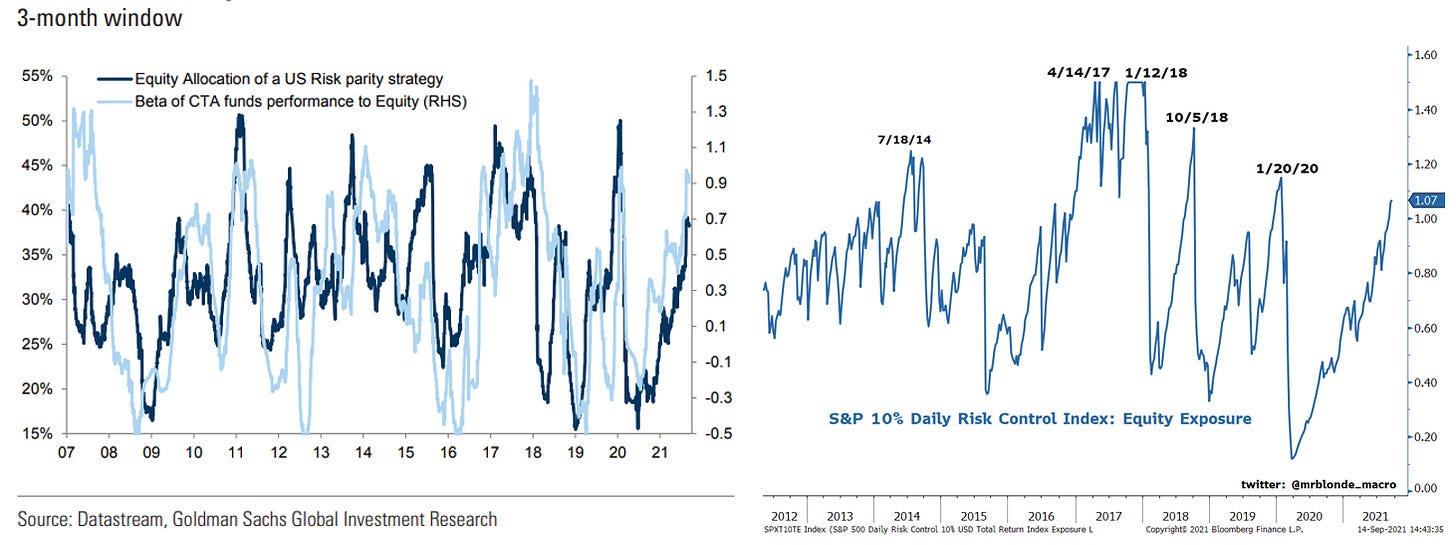
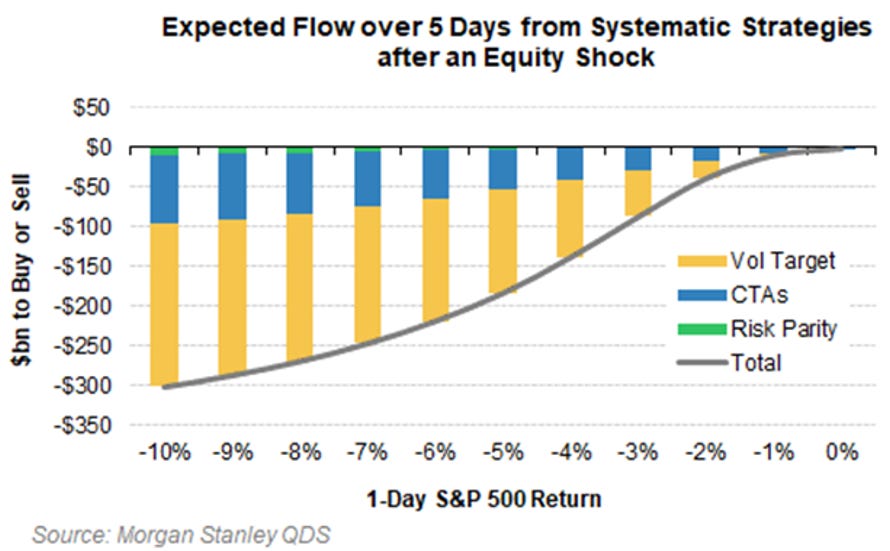
Systematic strategies (CTA, risk parity, volatility target funds) have grown in size since 2008 and represent an important swing factor. This is a group of rules-based strategies that buy higher prices and sell lower prices – pro-cyclical risk taking. This group only comes into play when the participants mentioned above start to move their feet and/or the market is hit with a negative surprise that shifts risk tolerance.
MS Quant & Derivative Strategies (QDS) group has done the heavy lifting and calculates ~$80b of subsequent selling pressure over 5 days should S&P 500 fall 3% in one day. A 3% fall is a big move no doubt, but its not unprecedented either. S&P 500 fell more than 2% on three occasions this year, despite what has been a good no correction period.
Bottom Line
Since mid-July, Mr. Blonde has been defensive seeing an opening for weakness until early/mid Oct. It has not been rewarding, but not particularly painful either and yet to see a relevant reason to change opinion.
We don’t know exactly where the pain point kicks in, but levels of positioning are high enough with growth momentum fading, central banks easing off the gas, more talk on taxes, Biden approval rating, 3Q earnings season, weak seasonal period, and sentiment deteriorating. When/if the market decides to take chips off the table, it appears there is a big stack to remove.


