Thoughts & Observations
good news on inflation is an important first step, many more to go
Summary of thoughts:
More bounce left in the bear, but margin of safety gone
Valuation alone a poor reason to buy/sell, but it can define ranges in regimes
Peak inflation momentum an important first step in healing process
Crowded positioning will exacerbate moves in a sensitive time of year
Update on recent ideas
Brief thoughts and observations after a wild couple weeks. Bottom line, the bear bounce got a second wind from softer inflation print, but chasing S&P 500 at/above 4000 is not likely to be rewarded. When asked early on, this was a level of interest for Mr. Blonde (here).
Without a doubt, peak inflation momentum is an important and necessary first step to better market conditions, but falling EPS estimates and a Fed still hiking >=50bps increments (+QT) remain stiff headwinds. And we have yet to digest the full effect of financial conditions tightening from the last 6mos.
Establishing the Range
Current NTM EPS is $229, but is falling at a >2% monthly rate (i.e. negative carry) so assume its ~$225 in a month. S&P 500 found valuation support around 15.5x forward p/e and peaked in mid-Aug at 18.2x. Those levels result in S&P 500 price range of 3485-4095 (assuming $225 NTM EPS).
Could it go higher? Sure, markets overshoot, but you would need to be confident in either multiple expansion >18x or 2023 EPS >$225 and/or rising.
Inflation Elation
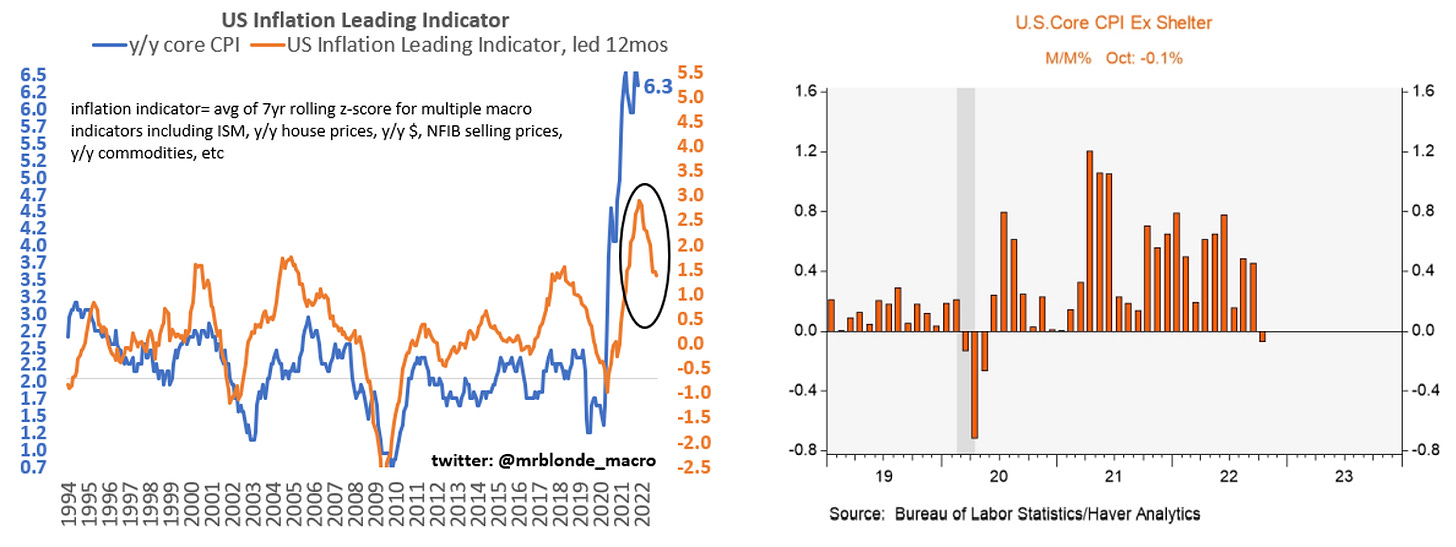
Clearly markets were desperate for some good news and got it from the Oct inflation report, but the magnitude of response was still a bit surprising. Didn’t we know inflation momentum was likely to slow?
The m/m fall in core goods inflation for the first time since mid-2020 was important as real time measures of shelter inflation indicate it will come off in 2023. The direction is clear, the path will be bumpy and the end point unknown.
Real Meaning of Peak Inflation
With inflation momentum peaked and y/y inflation measures coming down, it has put a lid on rate volatility. Charts below plot US 1y1y rate volatility given market sensitivity to policy action and path, but use any rate volatility metric you prefer (i.e. MOVE Index) and the message is the same. In fact, US 1y1y rate vol slipped below its 50d and 200d moving averages in the last couple weeks to suggest downside momentum.
As shared a couple weeks ago (here) the peak in rate volatility has helped establish a floor on equity valuation in the 15-16x forward p/e range. The rate/valuation relationship is also discussed here. Peak inflation momentum lowers the probability the Fed needs to go beyond current rate hike expectations (i.e. peak 5% rate) and reduces a primary source of anxiety. Markets prefer less uncertainty.
However, a floor in valuation is not the same as runaway expansion. The Fed is still in a tightening campaign and various measures of future growth negatively revised – hardly an environment for sustainably higher p/e multiples.
A Known Unknown
A year end unwind is the big unknown. Nothing against CTAs (commodity trading advisors), but trend following strategies have gotten large — some estimate >$350b before leverage. Trending markets has resulted in a buildup of positions and lack of diversification across market participant views. Said differently, everything is the same trade or some version of that ‘trade.’ The common factor appears to be inflation or some form of financial conditions tightening.
Nothing wrong with crowded trades, they often work…aka momentum. But given crowdedness such trades are vulnerable to periods of significant volatility.
Another likely influence is the time of year. Most institutional investors/traders are compensated based on calendar year PnL. A big slip up in November can be a big headache and wipe out 10 months of hard work, so the willingness to go against the flow isn’t there and can exacerbate short term moves. Recent price action has that flavor, lets see what next week brings.
Charts below measure the rolling 63 day % change correlation of the SG CTA Index (proxy for CTA funds) vs. major cross asset markets: SPX futures, Treasury futures, WTI oil futures and US$ index. Keep in mind that CTAs don’t care about fundamentals and simply trade the level and momentum of price…pro-cyclical flows.
Trend Still Matters
It would be nice if inflation were are only problem. Unfortunately, the rise in inflation invited a significant tightening of financial conditions which will weigh on growth over the next 6-12mos, if not longer. The direction of growth is reasonably clear to most, but doubts remain about severity as many still believe in soft landing or better.
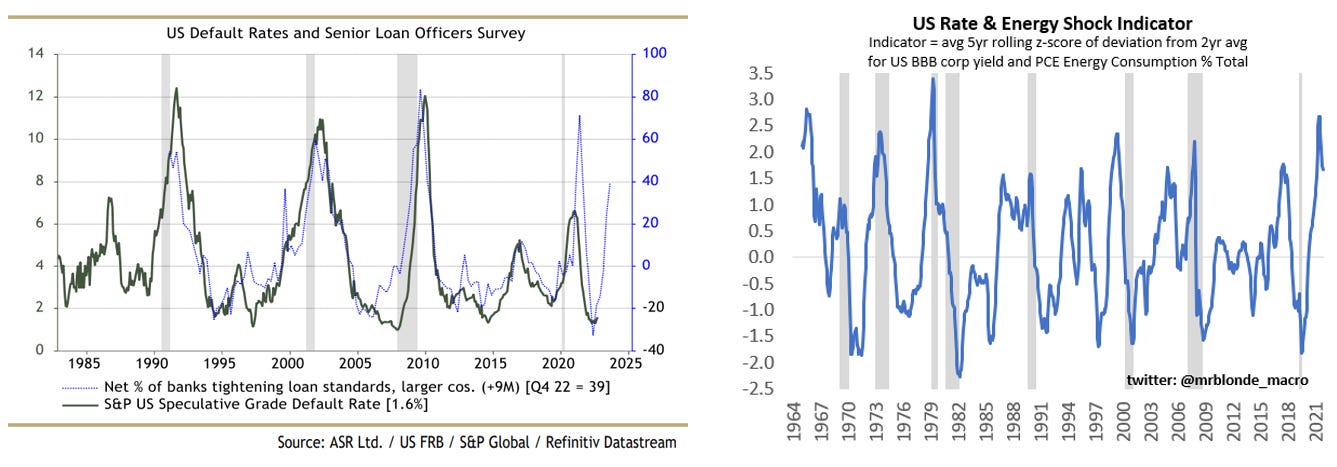
Market based measures of financial conditions indices can be volatile in the short run. Notable is the recent Fed Senior Loan Officer Survey (SLOS) which showed clearly banks have tightened standards and in many areas demand for credit has pulled back. The great twitter: @IanRHarnett highlighted this with a chart of net % of banks tightening standards leading by 9mos vs. US speculative grade credit default rate.
Bottom line, the tightening of financial conditions has yet to show up in the real economy in a material way ex housing. Many assume its because the economy is more resilient, but Mr. Blonde thinks the weight of evidence is clear and they just haven’t given it enough time (here).
Are you gonna bark all day little doggie or are you gonna bite?
Brief update of recent ideas and will offer some new ones this week.
Utility Futility
Back on 9/30, Mr. Blonde recommended buying oversold Utilities as a measured play for a bear bounce. In hindsight this was not a great call as Utilities sold off into mid-Oct. The view was based on short term mean reversion and a data study spanning more than 30yrs. This just serves as a reminder that even good setups have a probability of being wrong. This trade has room to recover further, but it is substantially smaller for Mr. Blonde as we pass the window for mean reversion to work. Want to stay disciplined in a difficult market and not trying to stretch a single into a double (baseball analogy).
Software / Semis
This ratio has been pretty frustrating this year as its shown signs of working only to be smacked down into a sideways, choppy range. The last couple months has proven to be more of the same just as Mr. Blonde thought it was setting to break its downtrend.
Unfortunately, the negative fundamental reports from semis in Sept-Oct period were followed by negative fundamental reports from software as the groups trade punches. So the short term technical picture has weakened, but overall picture has not changed much with sideways choppy action and some upturn in moving averages.
Falling PMI environments typically favor groups with less cyclical earnings streams and that has been the case today as well between software and semis. The big headwind for software stocks was expensive valuation and over ownership coming into 2022, but both seem to be in a better position today. Frustrating to date, but still think this can be a good pair into 2023.
Oh Mo!
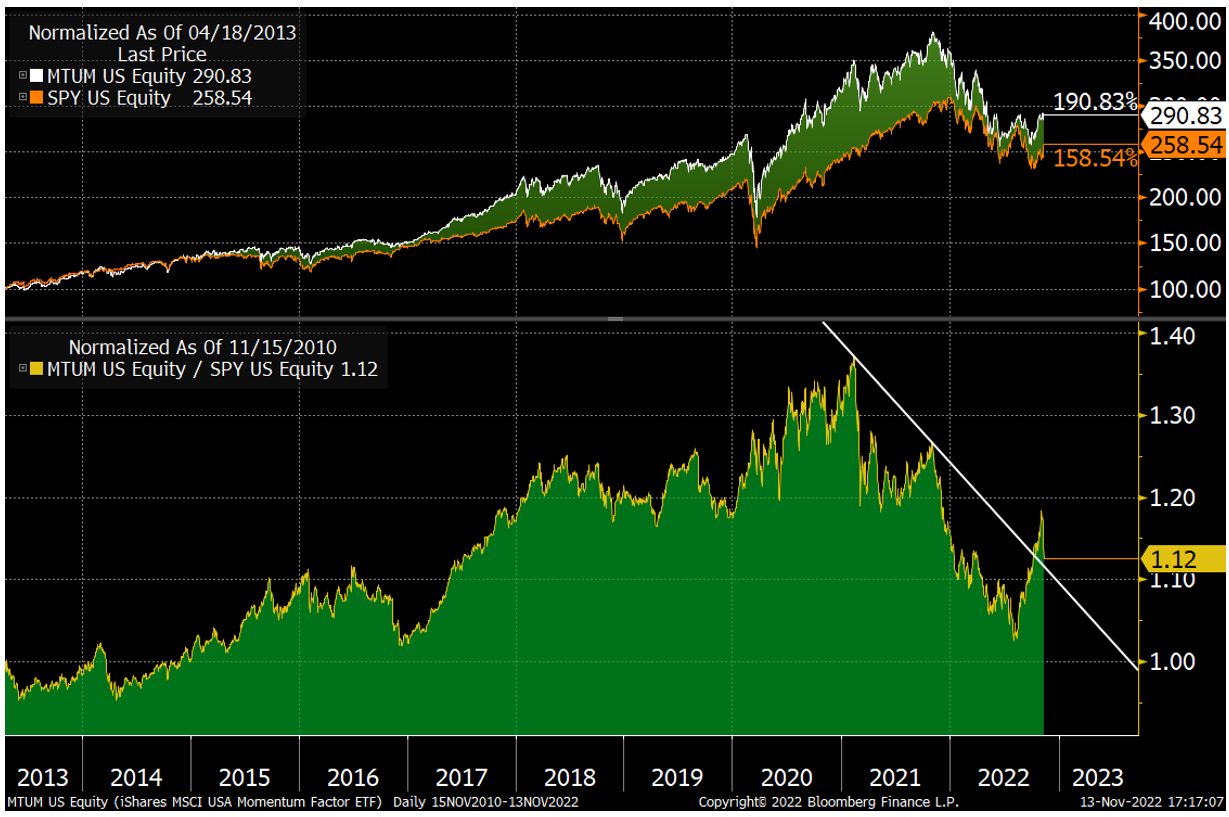
A couple weeks ago Mr. Blonde suggested long MTUM (momentum ETF) vs. SPY. This commentary is already too long, so there will be a separate post on the recent evens in the momentum factor and what it might mean for markets. Sticking with this one for longer as the quality + value composition of momentum remains attractive as does the sector composition energy + health care + staples for the macro regime (i.e. late cycle weak growth, peaking inflation).
Coming soon…a post on the earthquake in the momentum factor last week and what it might mean for markets as well as a data driven wrap up of 3Q earnings season.
good luck trading your view


The momentum unwind on Thursday & Friday was wild. Haven’t seen that magnitude since early 2020. Definitely some people with this year’s “easy” trades getting unwound. Downside moves in defense & health care creating some interesting opportunities. Obviously the huge rally in low quality, cash burning zombies was the other side of the unwind (lower rates/tightening spreads). Probably some opportunities there as well but that requires a bit more bravery and timing skills. Looking forward to the follow up, take care.
Worth waiting for