Summary:
Last week’s CPI report triggered one of the largest US momentum factor shocks on record (> 7 sigma) which continues to reverberate
Among style factors, momentum is the factor that tends to carry the most ‘macro’ exposure as it latches onto trends and what’s working
We explore past shocks, seasonality, what makes up momentum and what it might mean for markets
Risk reduction comes in more than one form. This episode looks more like short covering in the late stages of a bear market rally (at an awkward time of year) but there is scope for regime change given significant macro sensitives in momentum
Finally, if you have a strong opinion on what this recent volatility might mean please share it in the comments section, Mr. Blonde is staying open minded on this one and a taker of views
Momentum Shock
Momentum investing is a key factor for active equity investors—both quant and fundamentally focused. Its characteristics are unique because it only uses price performance and therefore its fundamental exposures can (and do) change over time – a chameleon factor.
While many were hyperventilating about the FTX clown show at the circus, active equity market participants were digesting one of the largest two-day shocks in price momentum in over four decades. Momentum shocks happen for different reasons, but it’s often the case something shifted in the macro narrative to suggest the previous trends are likely to change. Time of year and investor risk tolerance also play a role.
NB: There are many versions of momentum, but here the measure is sector neutral 9mo returns (9mos – prior month) for the US large cap universe (~1000 companies) with monthly rebalance.
More Volatile than Usual
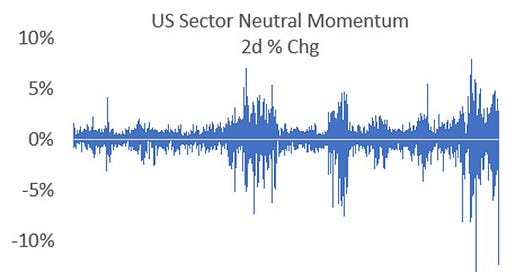
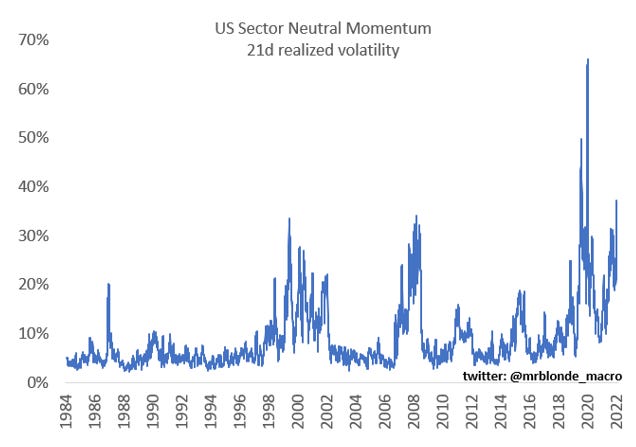
First, a long history of sector neutral momentum factor returns shows periods of calm are often followed by clusters of significant volatility. Perhaps recently lost in the top-down view of equity markets is just how volatile it’s been from a bottom-up perspective even after removing big sector tilts.
Second, the most recent two-day decline in momentum ranks as one of the largest on record (per Mr. Blonde’s daily data back to 1984). Even adjusted for the higher volatility the move represented almost -7 sigma event based on 5yr daily lookback (-11 sigma using full period returns).
Mr. Blonde views momentum as a form of “carry trade” within equity markets. The “carry” comes from persistent incremental good/bad news drives relative performance. That news could be earnings revisions, corporate commentary, a macro factor (i.e. $, rates, commodity, etc.) or more likely a combination. The primary risk in long momentum factor is periodic narrative shifts that can drive significant volatility. And volatility is kryptonite for any carry trade.
Such a large shock wreaks havoc on active equity portfolios – think longs down, shorts up – and can be a P/L killer especially for market neutral long/short investors and arguably worse for fundamental investors that pay less attention to factor exposures.
More detail below, but the move was driven primarily by short side of momentum (laggards outperforming) which has been happening more frequently in the last few years as evidenced by the charts below. Viewed this way it suggests the primary motivation was late year risk reduction following a good 9-10mo trend in relative performance.
Momentum is Macro
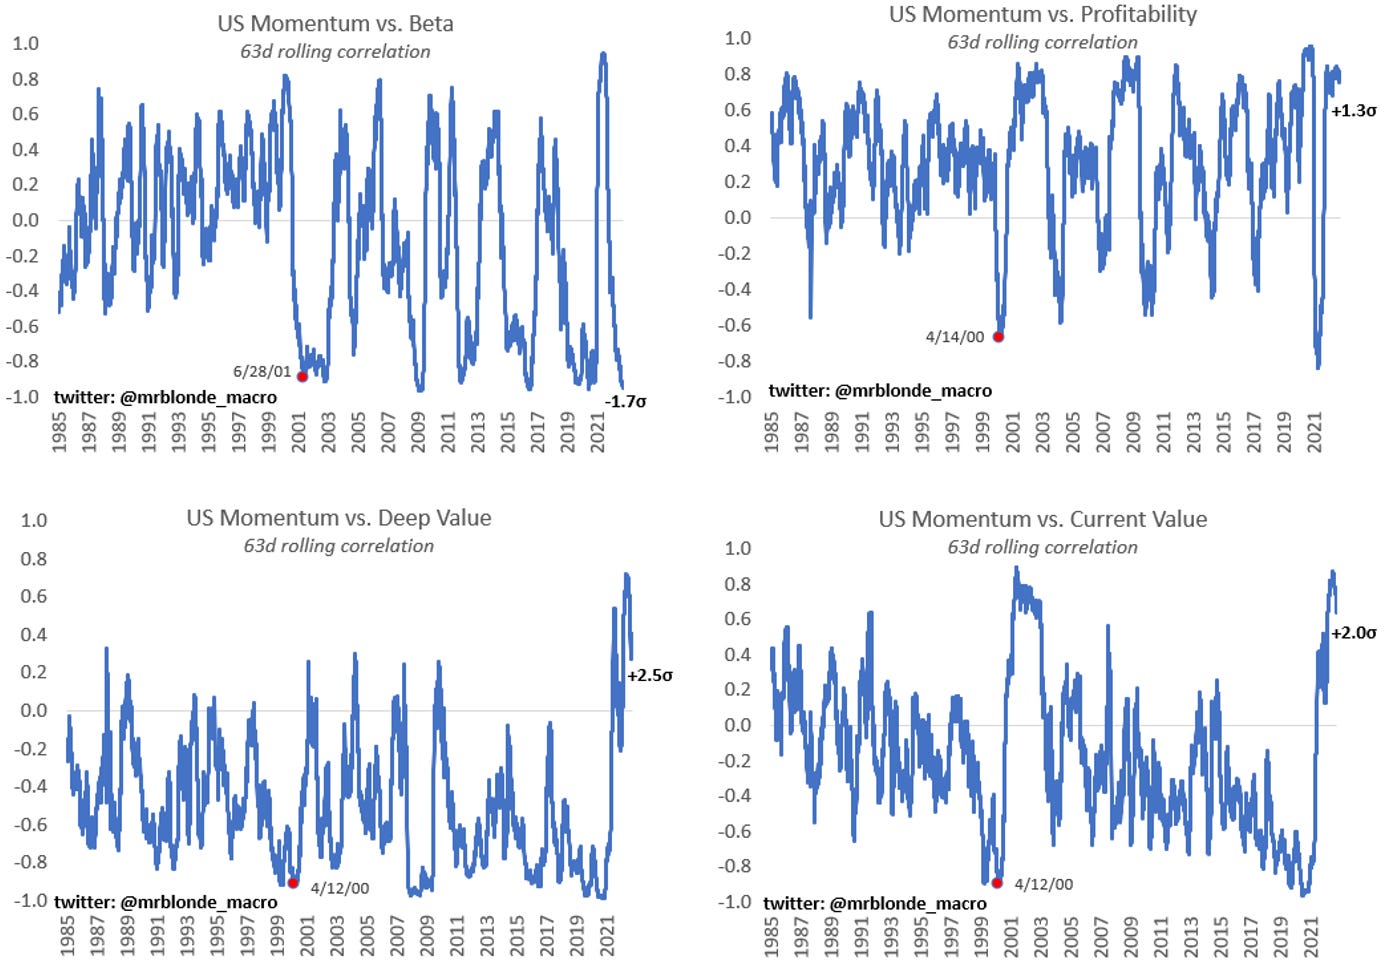
The next time someone tells you macro isn’t part of their process and they only focus on company fundamentals, please remember these charts. While the momentum factor is an extreme representation of this, it has become incredibly difficult to remove macro from the investment process. Implicit risk from this factor is incredibly high.
Currently, the sensitivity of sector neutral momentum factor to macro factors like US Treasuries or US$ is > 2 standard deviations from the norm, which is closer to 0%. Oil used to be a bigger driver, but the 30% correction this summer resolved a lot of that sensitivity. Please keep in mind we are using sector neutral momentum here, so this is not about tech/banks, tech/energy or other big sector pairs.
Keep in mind similar exposures are held by CTA/trend following macro investors, discussed here.
Momentum Fundamentals
Momentum is a chameleon factor and changes to capture whatever is popular at the time — the favorite factor of Hindsight Capital. Keep in mind the measure used here is sector neutral, so there are an equal number of stocks from each sector on the long and short side (i.e. no big sector bets). Heading into late last week, momentum was heavily skewed towards low beta, profitable, value stocks.
You can see pretty clearly from the charts which characteristics are abnormal for sector neutral momentum. What stands out more than anything is the very strong positive correlation to value factors both deep (p/b, p/s) and current (p/e, fcf/ev, etc.) value factors. It’s incredibly rare for value to have so much momentum and is reminiscent of the extremes during/following 2000 period.
Mean reversion in this sensitivity would make sense. To be clear, mean reversion doesn’t need to mean that the trend goes in the other direction, but even more balance between value and other factors could drive 0% correlation to momentum which would be closer to long term average.
Momentum Seasonality
Its important to point out the tendency for the momentum factor to fail this time of year, particularly during the 1H of November where momentum returns are among the worst of the year over multiple lookback periods.
Mr. Blonde would point out a few potential reasons for this:
October is fiscal year end for large % of mutual funds and likely brings meaningful tax loss selling (i.e. sell losers) and therefore potential buying of losers in early Nov,
3Q earnings season is largely complete which means the main fundamental catalyst(s) for bottom-up investors are largely over for the year making shorts harder to defend,
significant growth in platform hedge funds with a focus on calendar year p/l (compensation) and unlikely to fight short term market moves late in the year (no time to make up the potential losses)
This isn’t a PhD thesis paper; Mr. Blonde is just sharing his opinion. Maybe it’s the lunar cycle (lunar eclipse on 11/8/22), who knows. Either way the historical stats tell you to be cautious momentum this time of year.
Past Perspective of Momentum Shocks
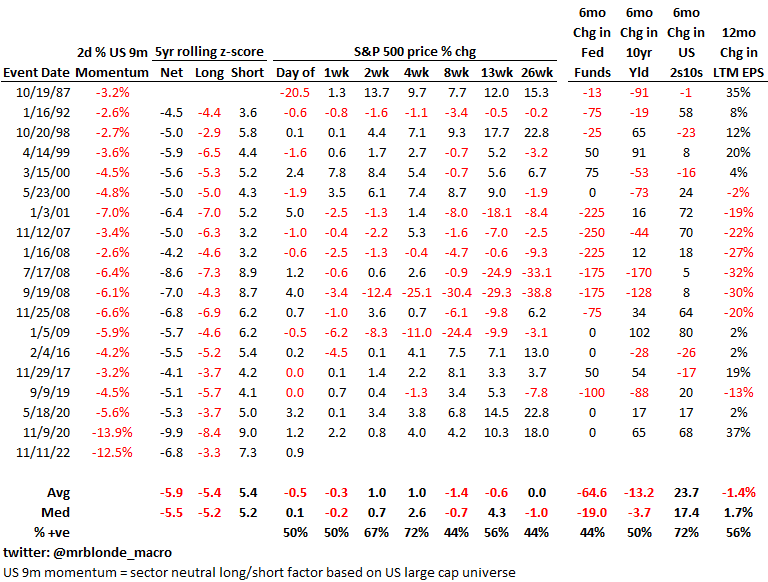
This table plots the largest 2 day down moves in US sector neutral momentum factor and removes aftershocks that occurred within the month following the first event. Typically, people believe a large negative momentum move comes near a market bottom, which is sometimes true, but it’s also a feature of bear markets like ’99-’01 and ’07-’09.
There are two additional important points. 1) increased frequency of momentum shocks in the last few years with very large moves coming from short side of momentum, 2) weak/negative EPS periods an important differentiator when thinking about what follows significant volatility in momentum, 3) subsequent market returns, on average, are inconclusive w/ weak bias.
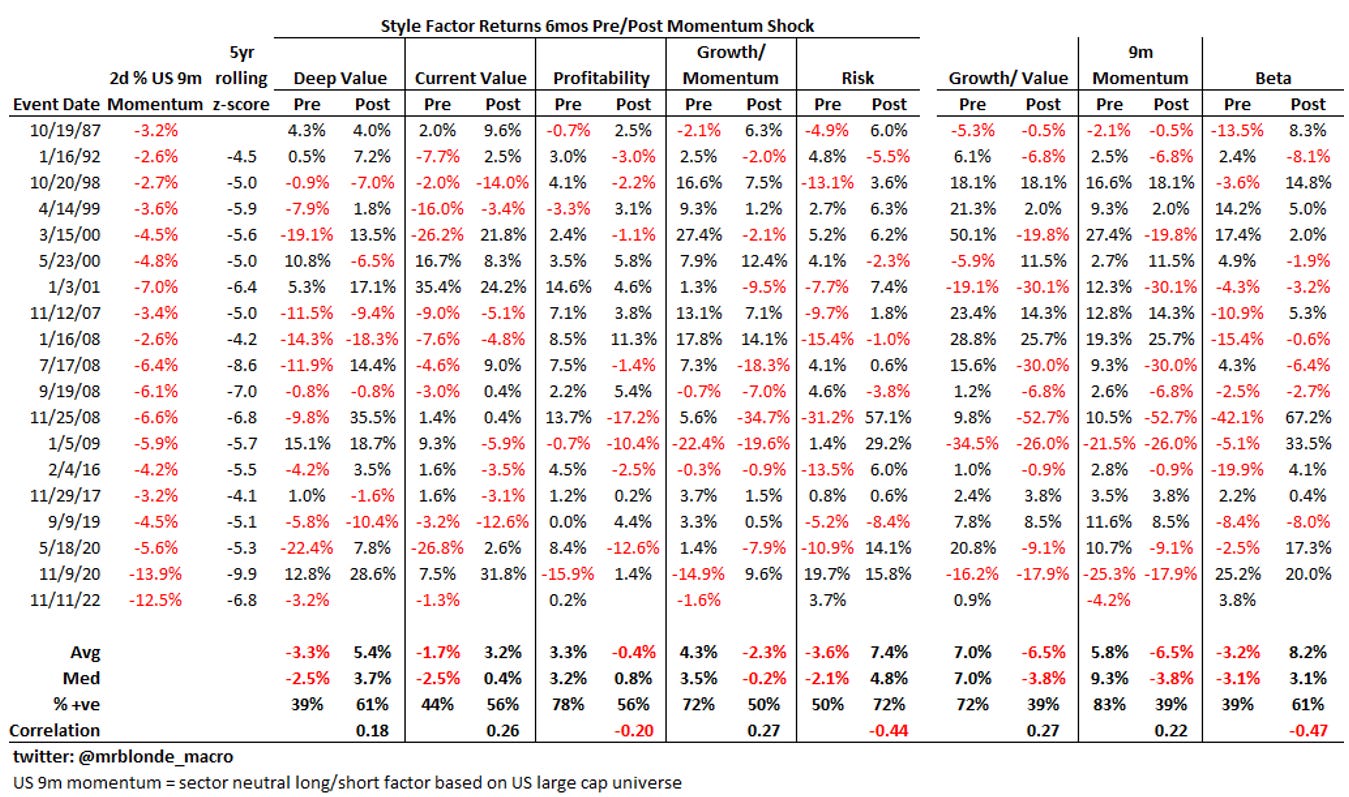
Often times a momentum shock leads to leadership change. This is admittedly a bit tricky to measure consistently over multiple time periods, but the table below makes an attempt by studying style factor returns in the 6mo period before and after the significant momentum drawdown. There is some scant evidence of leadership change, but its far from convincing.
Most interesting is the weak performance of momentum factor in the 6mos leading up to last week (i.e. no momentum in momentum). During past periods when momentum factor performed poorly that weak performance persisted following the shock (’87, ’09, ’20). Time will tell.
Concluding Remarks
That’s a lot of charts and data to digest. Something Mr. Blonde is still digesting and at this point does not have a strong conclusion on precisely what it means. It seems to be more a continuation of factor volatility that has been in place for sometime and a feature of bear market environments rather than a sign of a big change in market direction. The fact that it occurred on the day of a positively surprising CPI report highlights the macro importance of the momentum factor and definitely deserves attention.
If Mr. Blonde had to guess, he’d say it is likely the start of some shift in equity market leadership that leads to more balance between growth/value factors in an environment where rate vol and rate hike expectations become less the focus while growth and recession risk factors increase.






Sometimes the conclusion is more simplistic...we’re in a bear market driven initially by QT to attempt to combat inflation caused by years of QE...leading to P/E compression
What has happened in every bear market I’ve ever experienced...9 of them going back to 1966 are bear market rallies fueled by short-covering and hope that the worst is over.
We are in a bear market triggered by QE stimulated asset inflation undone by Inflation concerned QT which has resulted in P/E contraction. Now we transition, which Mr.Blonde has talked about, to an earnings implosion and a recession that drives P/Es even lower.
My advice Mr. Blonde, from an ardent fan, is to go back to your previous post...actually the best way to gauge someone’s usefulness as an analyst, where you posited that 17.5 times NTM earnings would cap the rally...conveniently at the 200-dma ...don’t throw in the towel based on factor analysis...machines can only override fundamentals in the short-term...ultimately earnings will drive prices...look back to 1973/1974 to find a comparable period...I lived through that and survived by not turning prematurely bullish.
I'm with B, being a taker of ideas and I don't have strong opinion. Personally, I'm being open to inflation not come crashing down next year as when inflation prints this high, history seems to suggest it can be a longer process on its path lower (sure, one can find differences in past circumstances vs today). But regarding the '87, 98, 20 examples, if financial conditions start to loosen to much I would guess that would make the fomc pretty uncomfortable, particularly if we haven't seen several prints suggesting lower inflation. It may be possible that the current terminal rate still needs to rise next year. Productivity and the natural rate of unemployment may be potential influences.