This commentary remains free for all, but come 10/31 will require a monthly subscription. See here for details and expectations. Hopefully after reviewing content provided over the last year you will find it well worth the price.
Brief post updating earnings season statistics and make some chart driven observations to put the season in perspective to this point.
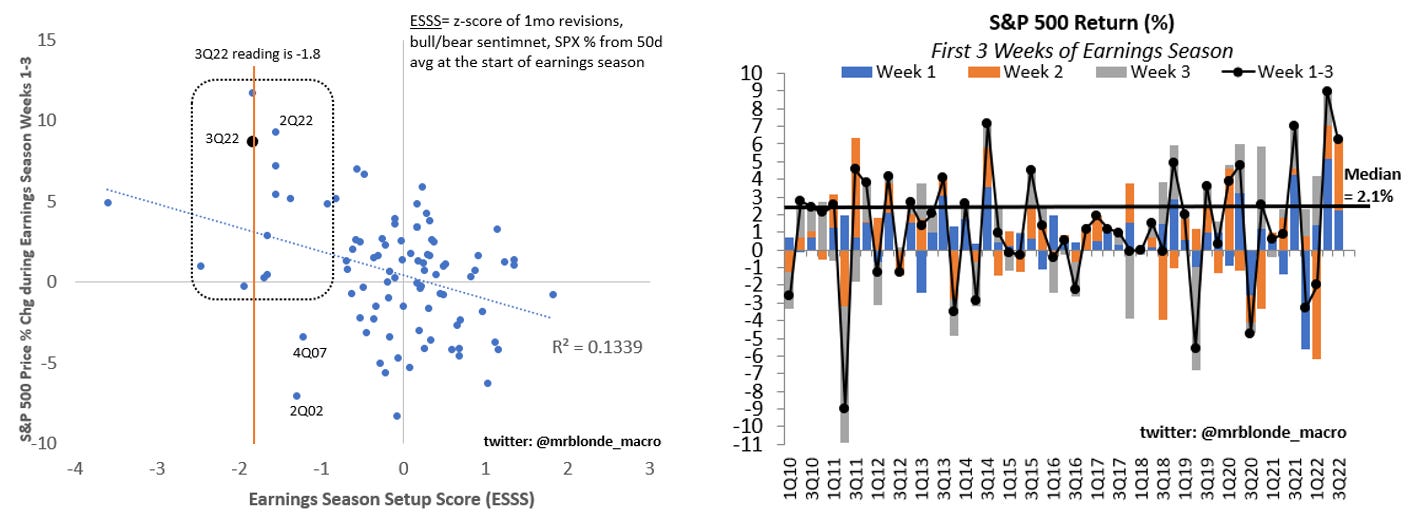
Before touching on reported fundamentals, the main story of earnings season so far has been stock market performance. As a result, many will suggest “earnings are good” but first consider the earnings season setup score (ESSS) which Mr. Blonde flagged a couple weeks ago (here). Bottom line, US equities have a tendency to perform well during earnings season and that performance tends to be stronger when pessimism is high coming in as it was today. But stock price performance alone shouldn’t be used to determine the quality of earnings season.
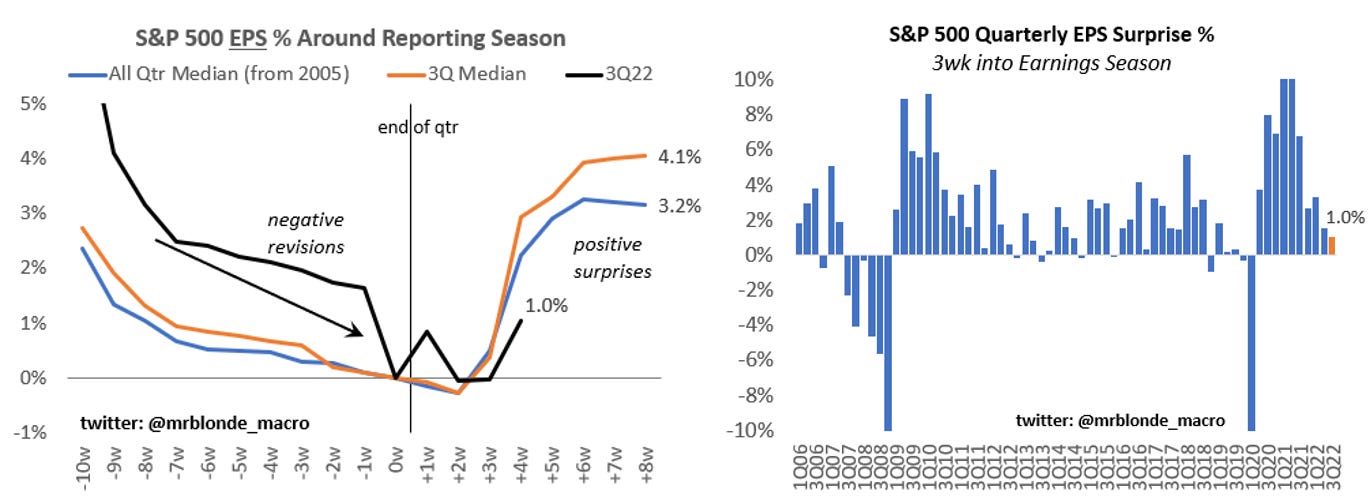
In aggregate, earnings “beats” continue but at a substantially slower pace that past seasons and when we consider the breadth and magnitude of negative revisions to 3Q forecasts it can hardly be considered a “beat.”
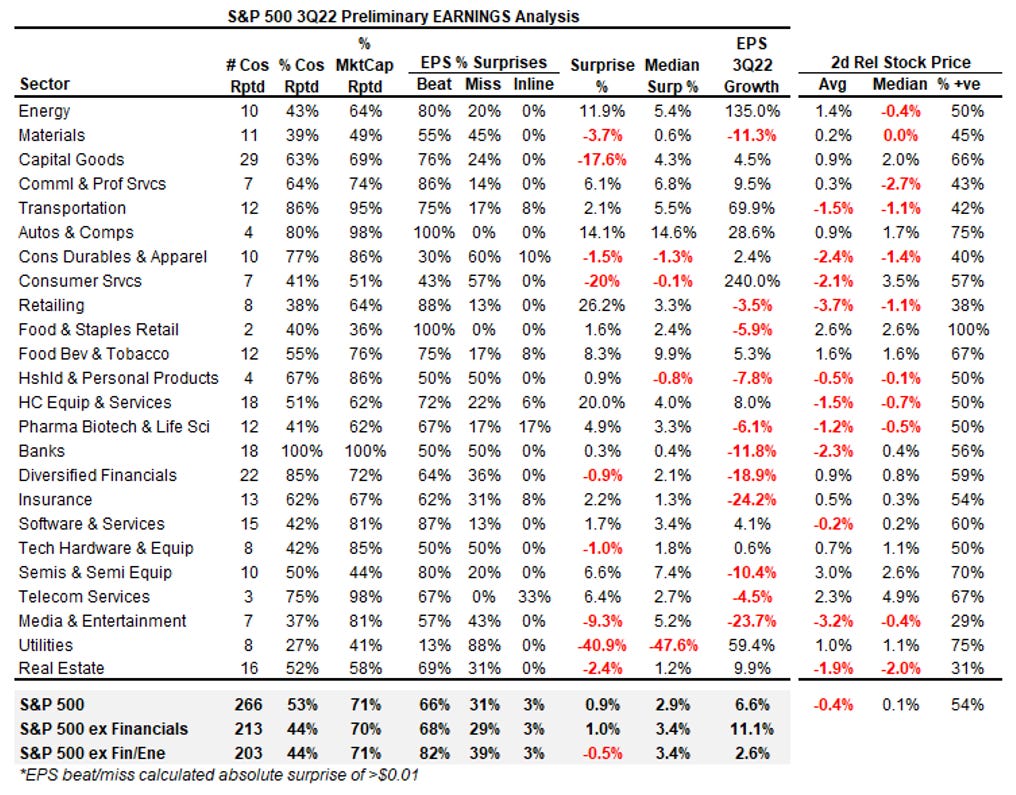
To date, 266 of S&P 500 companies, representing 71% of market cap, have reported. As typical, more than 60% “beat” EPS, but surprise magnitude at +0.9% is well below average and more groups are showing negative y/y EPS growth trends.
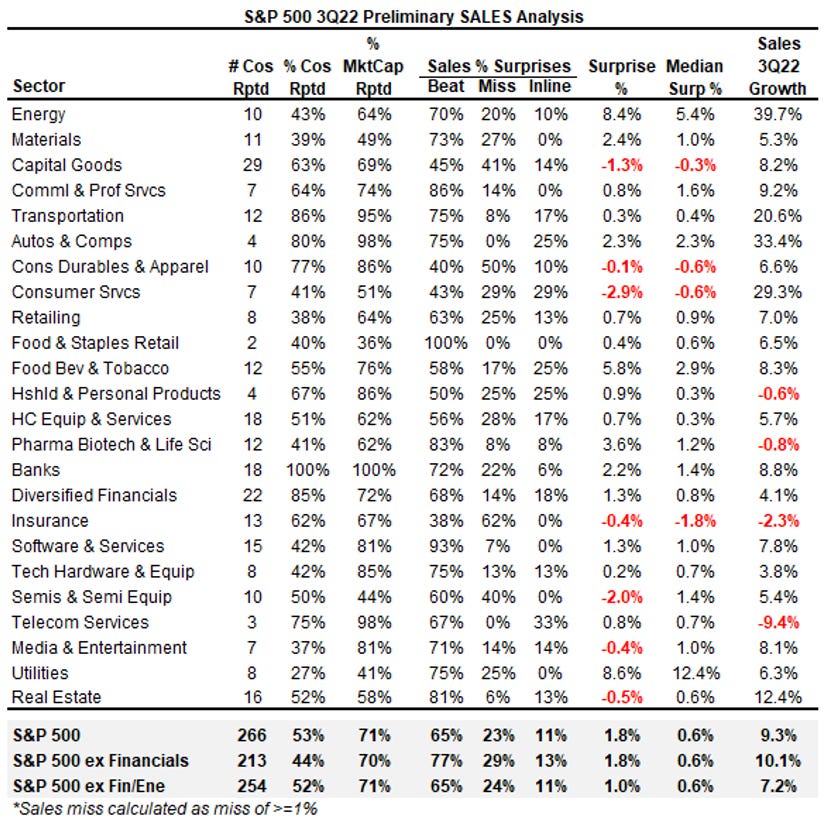
Sales trends have been better both in terms of surprises and y/y growth rates as the elevated nominal growth environment has been supportive. This has the potential to change in a meaningful way in 2023 as nominal growth falls off in response to tightening financial conditions.
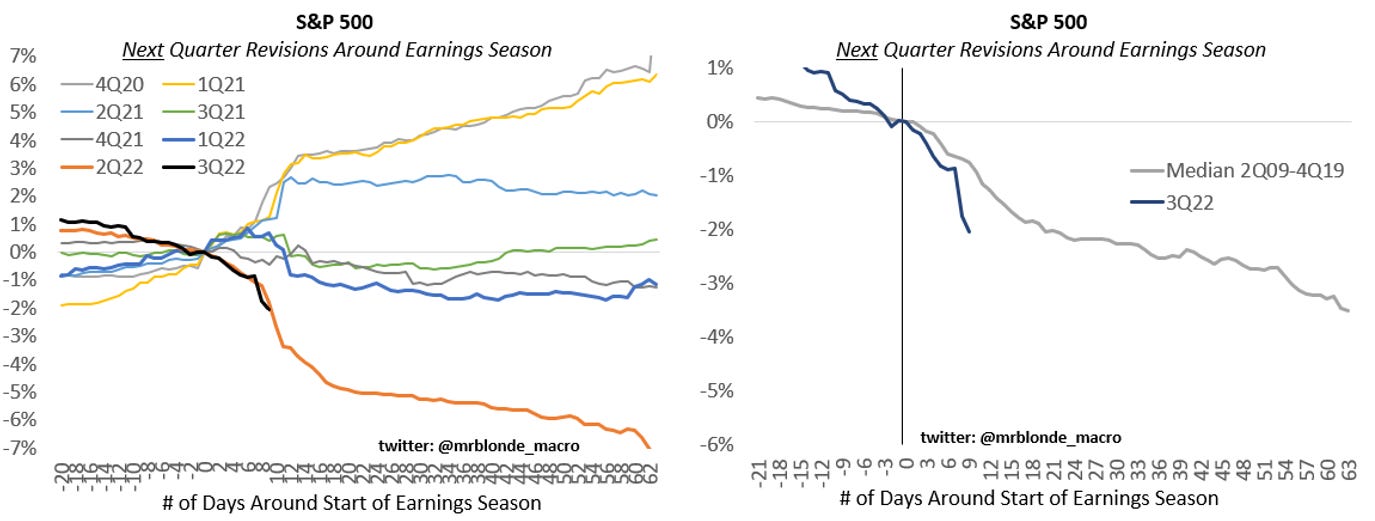
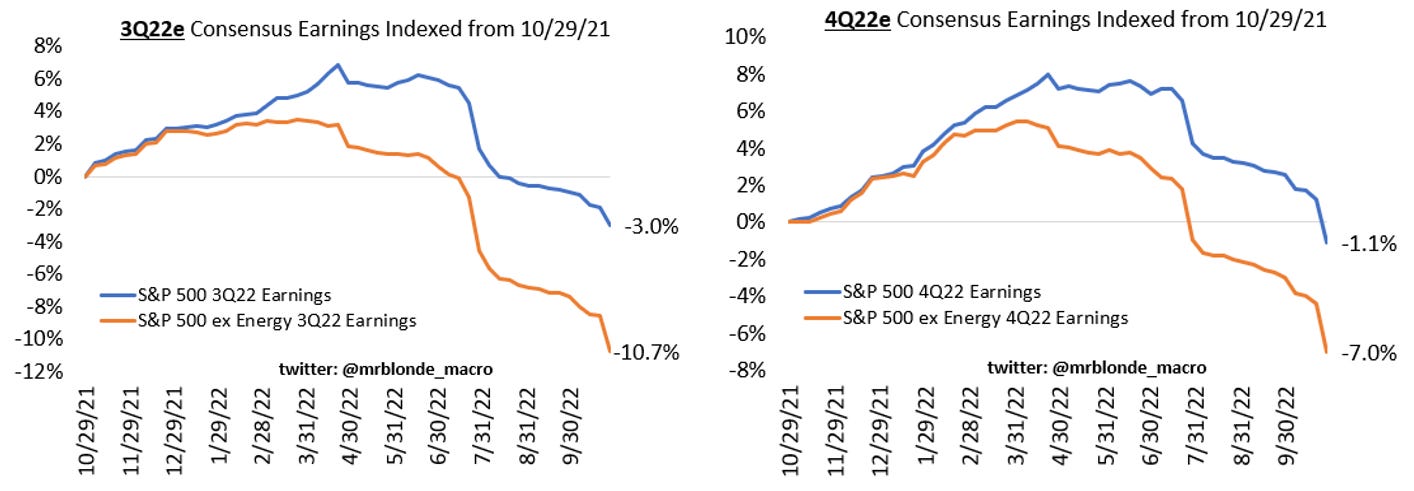
Similar to 2Q earnings season we see negative revisions to 4Q estimates as companies report. Negative revisions to the subsequent quarter is not all that uncommon, but the magnitude is running more than normal and it’s a clear change when comparing to the recent past.
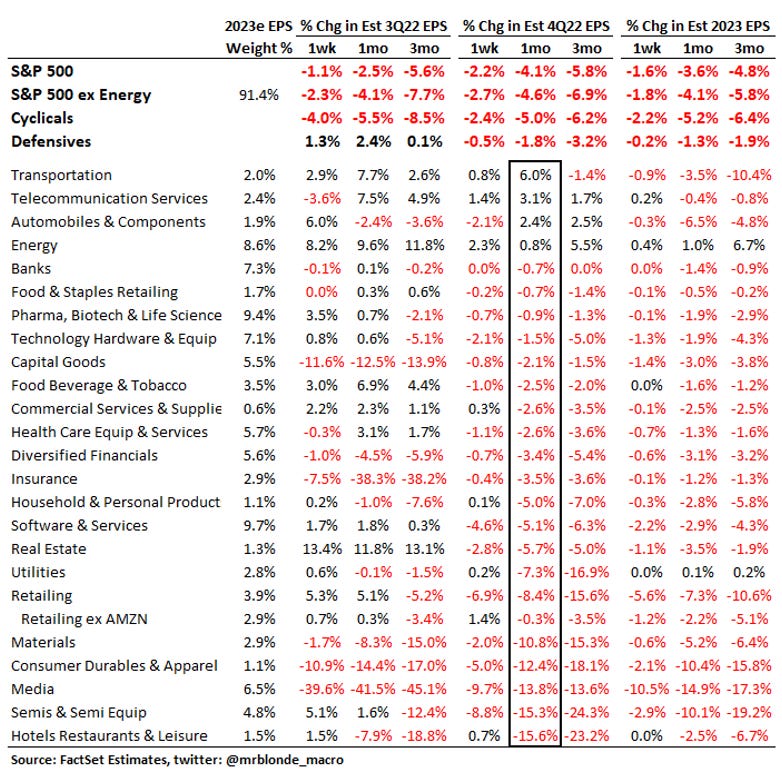
The energy sector has been a source of relative strength, but even there its proven hard to hold things up as oil prices slipped below $100. The breadth of negative revision trends for both 3Q and 4Q shows clearly how growth conditions have changed in 2H22 and heading into 2023.
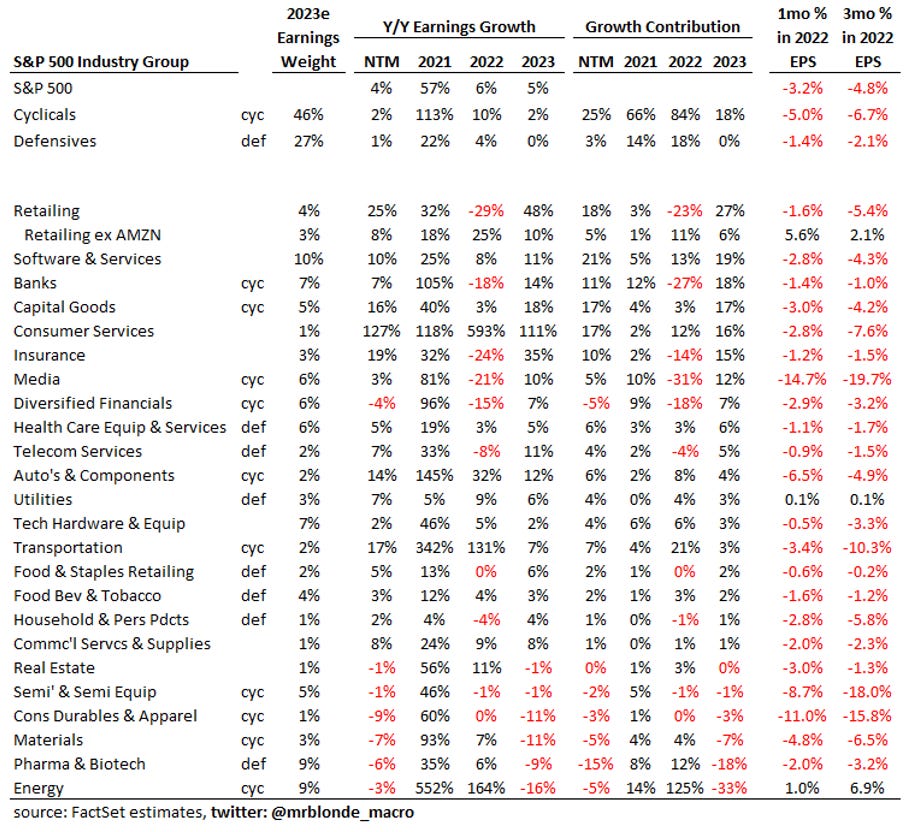
This table provides detail by group and is sorted by 4Q23 EPS revision over the last month. Virtually no where to hide with confidence.
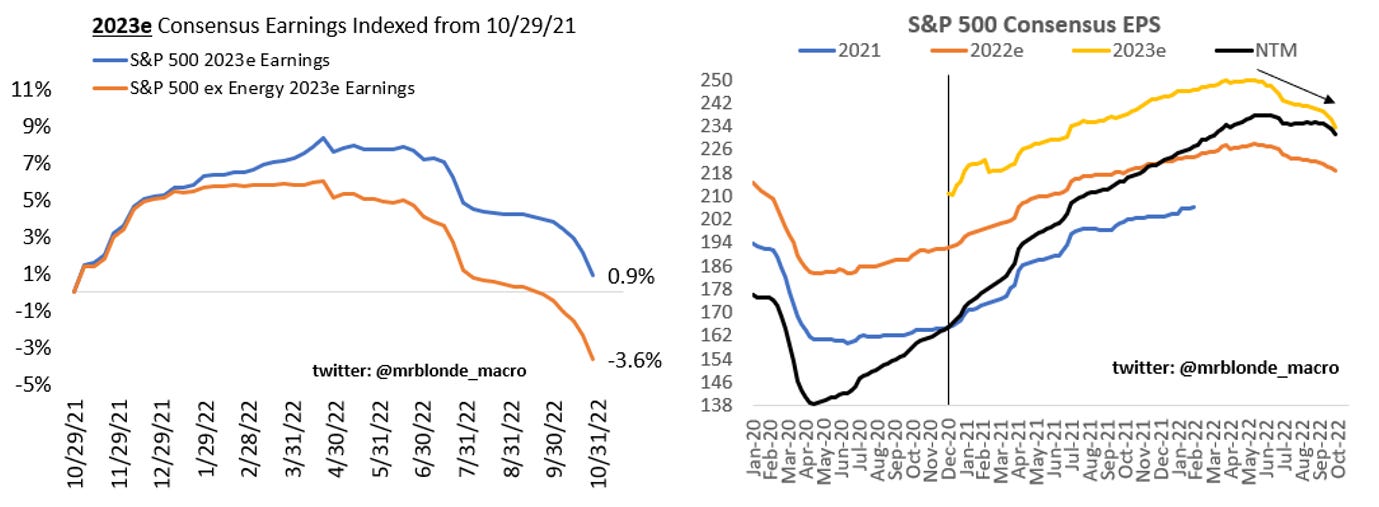
The negative revisions are carrying over into the 2023 profit outlook and likely to continue to do so. With NTM (next twelve month) EPS now falling, equities have negative carry attributes and represents a stiff headwind to returns.
A detailed look at US earnings growth and growth contribution sheds light on where market is expecting growth to come from next year. More to discuss on this later, but negative contribution from energy and pharma look too pessimistic in 2023, while retailing, capital goods, consumer services, autos, transportation, and tech hardware look optimistic.
Earnings continue to track along the forecast Mr. Blonde has had from the start of the year…growth deceleration this year turning into negative growth later this year into early 2023 (here). So far, nothing from recent earnings seasons would suggest that its off track, if anything, its a bit ahead of schedule.
Hope you appreciate the earnings season perspective and observations. An updated view following the Bear Bounce call from a month ago will be shared soon. Stay tuned.


Are there any data sources that show S&P 500 earnings contributions by company? Meta, Amazon, and Google year-over-year earnings declines for Q3 were significant (likely to continue in Q4) and I'm curious if the estimates have already been updated to reflect them. They still have significant weighting as well
I really appreciate this detailed & clear-eyed assessment. I'm a new subscriber -- thank you. Really looking forward to the follow up to the "Bear Bounce" article.